The Forecasts module is included in the Plus and Premium subscriptions, and allows three kinds of forecasts reports.
- Multi-Year Projection - Project future budgets across multiple years based on the selected source budget.
- What-If Analysis - Compare multiple scenarios for possible changes to a full year's source budget, for example a great economy vs. a bad economy.
- What-If Analysis by Month - Update specific months (up to 12) from an underlying source budget in a standalone scenario to see the forecasted impact for that single budget year.
Features of Forecasts include:
- Forecast year-over-year changes to any budget within Martus based on the dimensions, accounts, or account categories selected.
- Project forecasts for the current year, or up to 9 years into the future – with the years shown side-by-side for easy comparison.
- Add notes to explain future adjustments and assumptions, and quickly see the results in the form of impact to the bottom line.
- View results in the same summary/detail views used throughout Martus. Results can also be exported to Excel.
Forecasts is a selection on the Planner menu. This feature is automatically available to Admin users. Permission to use this feature can also be assigned to non-admin users, and they will only be able to see budget information and prepare forecasts for the dimensions to which the user has access. Admin users can see and edit all forecasts, regardless of who created them. Note that forecasts created here do not have the ability to be set as a budget.
NOTE: Changes to the Source Budget selected for a forecast can significantly impact a Forecast in the Forecast Module. When you create a forecast, it is based on the selected source budget, and any changes to this source budget will affect the forecasted outcomes.
Managing Forecasts
When you select Forecasts from the Planner menu, you see a list of existing forecasts. Create as many forecasts as you'd like. The forecasts are listed for the current budget year. An Admin user can see all forecasts. A non-admin user can only see the forecasts that they have personally created.
Take any of these steps on the Forecasts page:
- Select a year and click Load Budget Year to change the current year and show forecasts for that year.
- Click Add a New Forecast to create a new forecast.
- Click Edit to view and change detail for a forecast, or to delete a forecast.
- Click Results to proceed to the results report for a forecast.
- Click Copy to create a copy of an existing forecast.

Creating a New Forecast
- Navigate to Planner > Forecasts.
- Select the Year for the new forecast.
- Give the forecast a Name. Max characters is 100, but only about 25 will show on the screen.
- Specify the Type of forecast you wish to create.
- Multi-Year Projection and the Number of Years
- What-If Analysis and the Number of Scenarios
- What-If Analysis by Month and the Number of Months
- Select the dimensions, accounts and account categories (unique to your instance of Martus) to include in the forecast.
- Select the Current Budget from the dropdown for Admin users; a forecast by a non-admin user is always based on the default budget for the selected budget year.
Note: Any budgeted amounts for Excluded accounts will NOT be included when creating a forecast. Use the steps below as a workaround:
- Open a tab in your browser with just the Excluded accounts showing in Setup > Accounts. Then duplicate that tab and make the Excluded accounts not Excluded. Be careful not to do anything to the original tab.
- Create a forecast from the budget desired, with all accounts now Included.
- Go back to the original tab, select all the accounts, and make them Excluded again.
7. Click Preview to see the Forecast Detail screen and then enter the adjustments that will shape your projections for that forecast. Select and updating the various amounts by flat amount or percentage.

Navigating Forecast Detail
Forecast Detail summarizes your budget based on the configuration of the forecast (the dimensions and account information) that you selected. Filter the display as desired.
Delete any lines you don’t want to consider in the forecast, and add any lines that weren’t budgeted but that you want to include in your projections. Note: You cannot add or remove dimensions from the configuration.
The forecast has sections with totals for each type of account (Income, Expense, Other Income, Other Expense, and Cost of Goods Sold). It also shows the impact of your projections for each account type and each month/year.

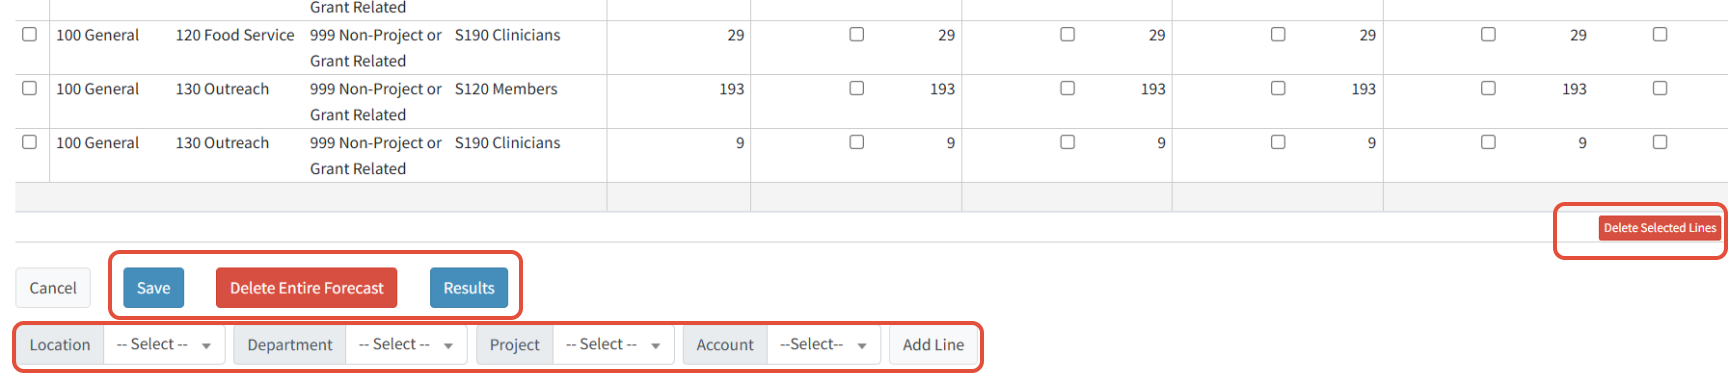
Updating the Forecast
Use the checkboxes in the grid to make adjustments to values in the forecast.
Updating Rows
Select one or more rows, and then click Adjust Selected to adjust by a Flat Amount or Percentage in a forecast. Enter any Notes pertaining to the Adjustment.


Updating Columns
Select one or more columns to make adjustments to a forecast. When you select an entire column, only the filtered rows will be adjusted.

Updating Cells
Select one or more cells to adjust them in a forecast.


Updating Notes
Click on a Notes icon to update the notes for that cell in a forecast.
![]()
Clearing Adjustments and Notes
Click on Clear to remove the adjustment and notes for one or more cells in a forecast.

Reviewing the Results of the Forecast
Select Results from the Forecasts list on the Forecasts page, or select from the bottom of the Forecast Detail. Forecast results can be viewed in the same summary/detail views used throughout Martus.

Options for the Rows dropdown include Detail view and summaries by anything used in the configuration of this forecast. You can also filter to any dimension or the level of account information included in the configuration. Results can be exported to Excel in order to be printed, for distribution, or for further analysis.

Forecasting Notes
Non-Admin users can be granted access to Forecasting but will only see the forecasts they create.
- While forecasts are very helpful for multi-year budgeting, it is important to note that they are only available to report on within the Forecasts module.
- Forecasts are user-specific, meaning each forecast is its own and doesn't consolidate across users. If the goal is to allow budget managers to review actuals and make changes to the rest of the year, use a reforecasted Planner budget with actuals.
Was this article helpful?
That’s Great!
Thank you for your feedback
Sorry! We couldn't be helpful
Thank you for your feedback
Feedback sent
We appreciate your effort and will try to fix the article