Planner Summary Reports
Planner > Summary > Budget Summary Report with Detailed Budget Analysis Export
The Planner Summary report can be filtered to a particular Year and Budget. (Only default and viewable budgets are available for non-admins.) You can also select the rows and columns, and filter on dimensions.
The Rows dropdown allows you to select from the following:
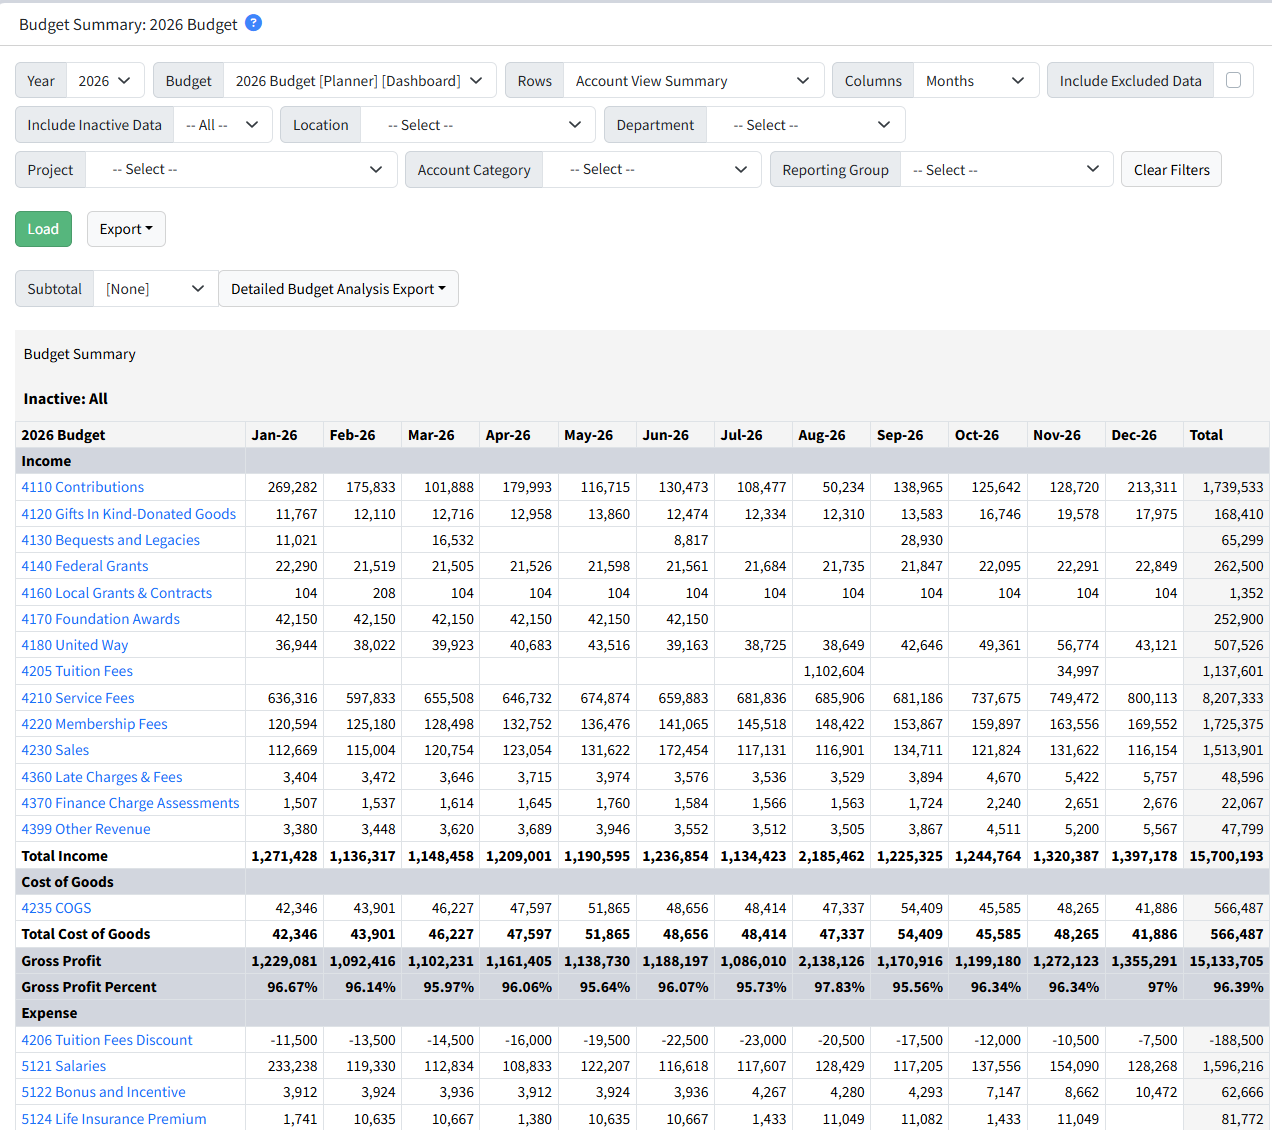
Account View Summary - Lists budget totals by account. You can drill down on any account to see all of the budget worksheets that use that account and access any notes on those budget items.
Account Category View Summary - Lists budget totals by account category. Any accounts that are not assigned to a category are grouped in the [Blank] category.
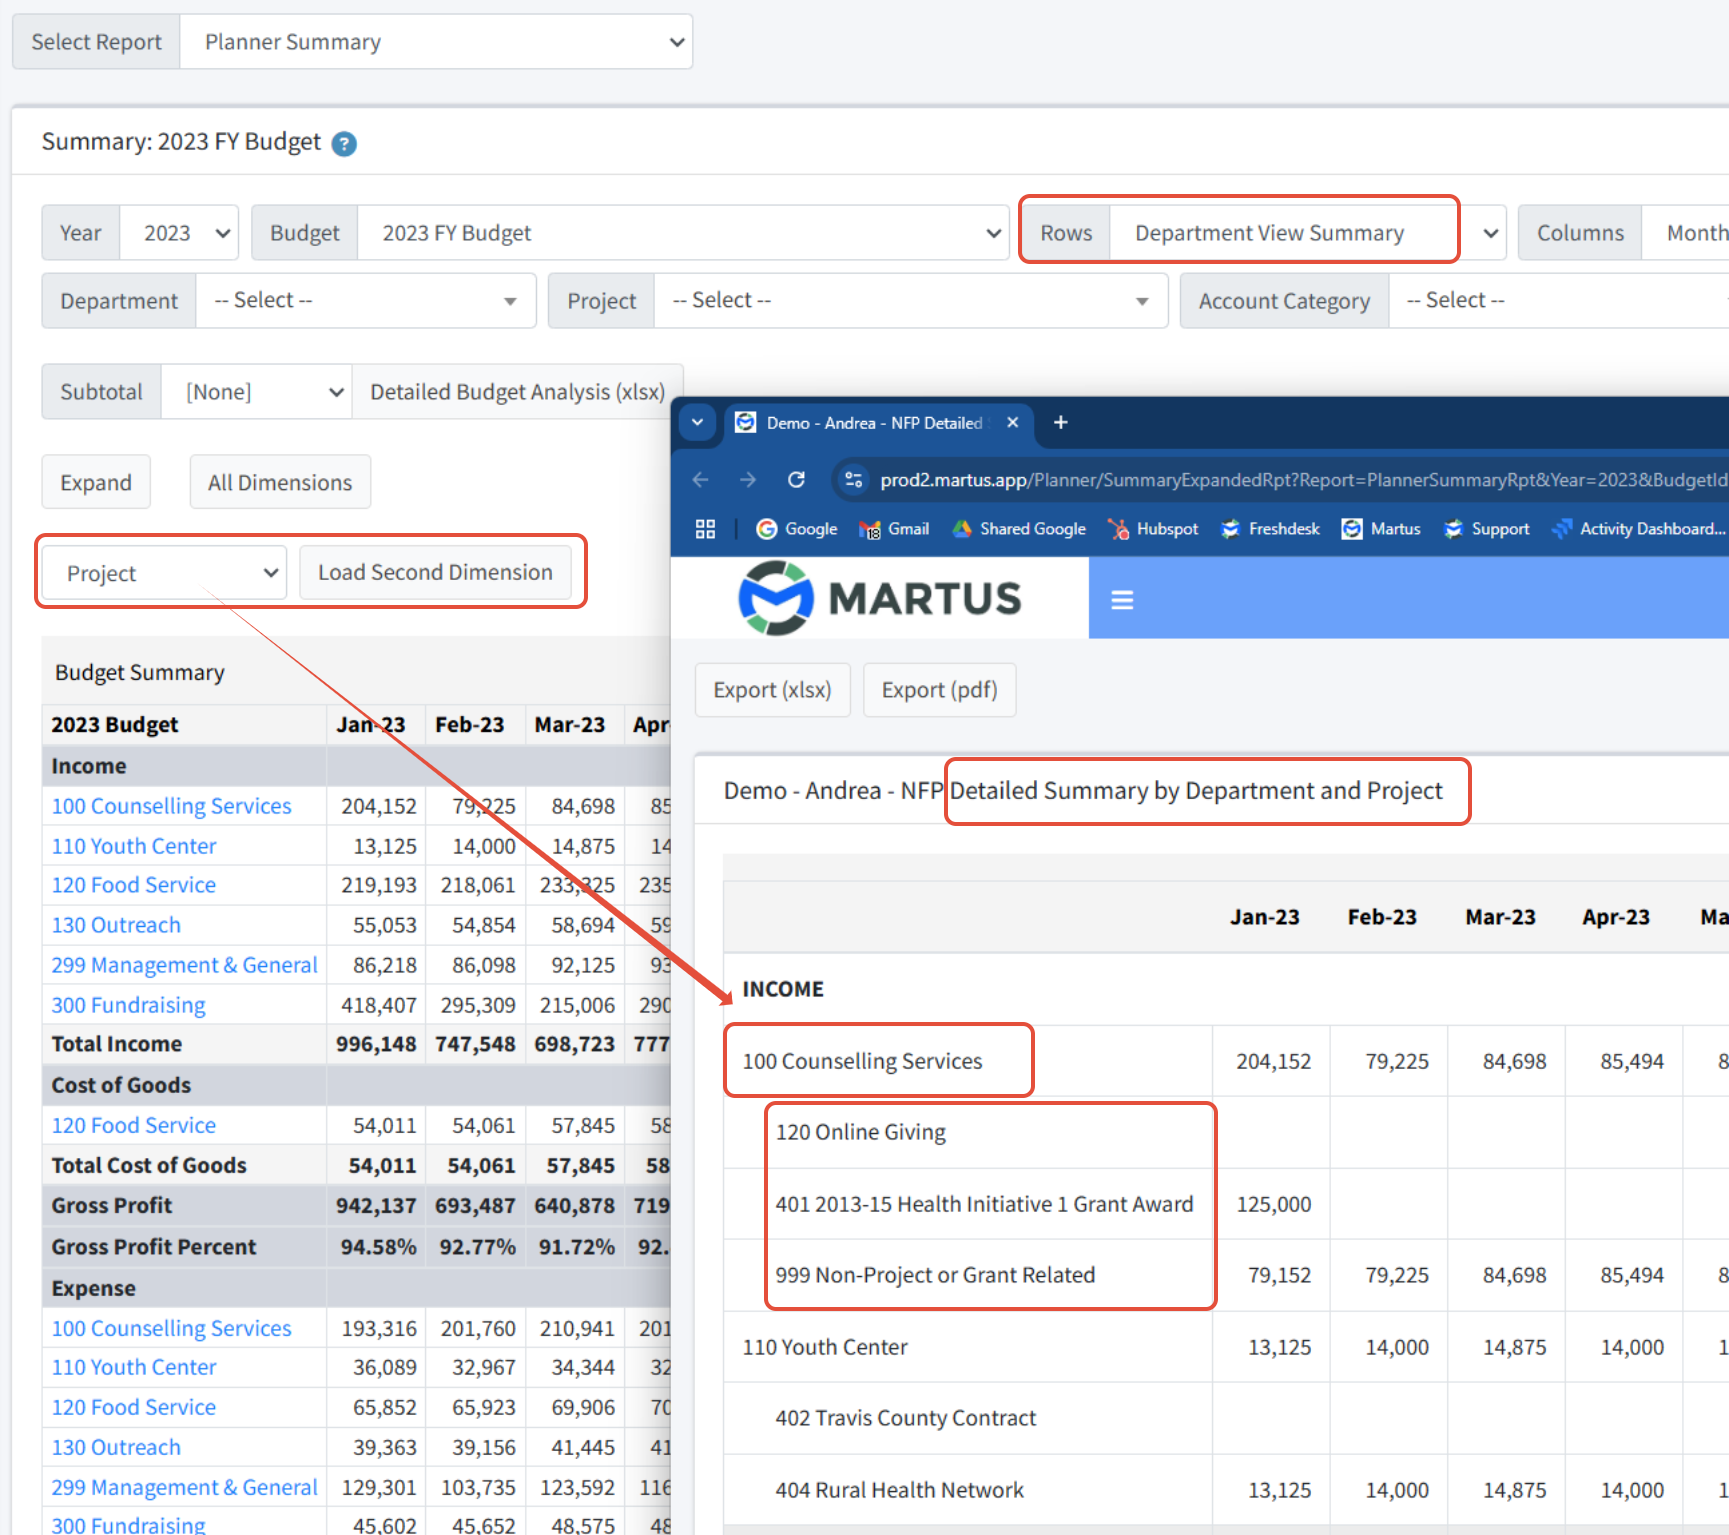
Dimension View Summary - Provides total budget information by the selected dimension, with separate sections for Income and Expense. For nested dimension values (parents and children), the totals are shown at the parent level. Click All Dimensions to see budget totals for all child dimensions, rolled up to the parents. Click Expand to see account-level budget detail within each child dimension, rolled up to the parents.
Dimension View Gain/Loss - Options summarize the budget in rows for each defined dimension. Click Expand to see account-level budget detail within each child dimension and rolled up to the parent.
The Columns dropdown allows you to select months or any dimension listed.
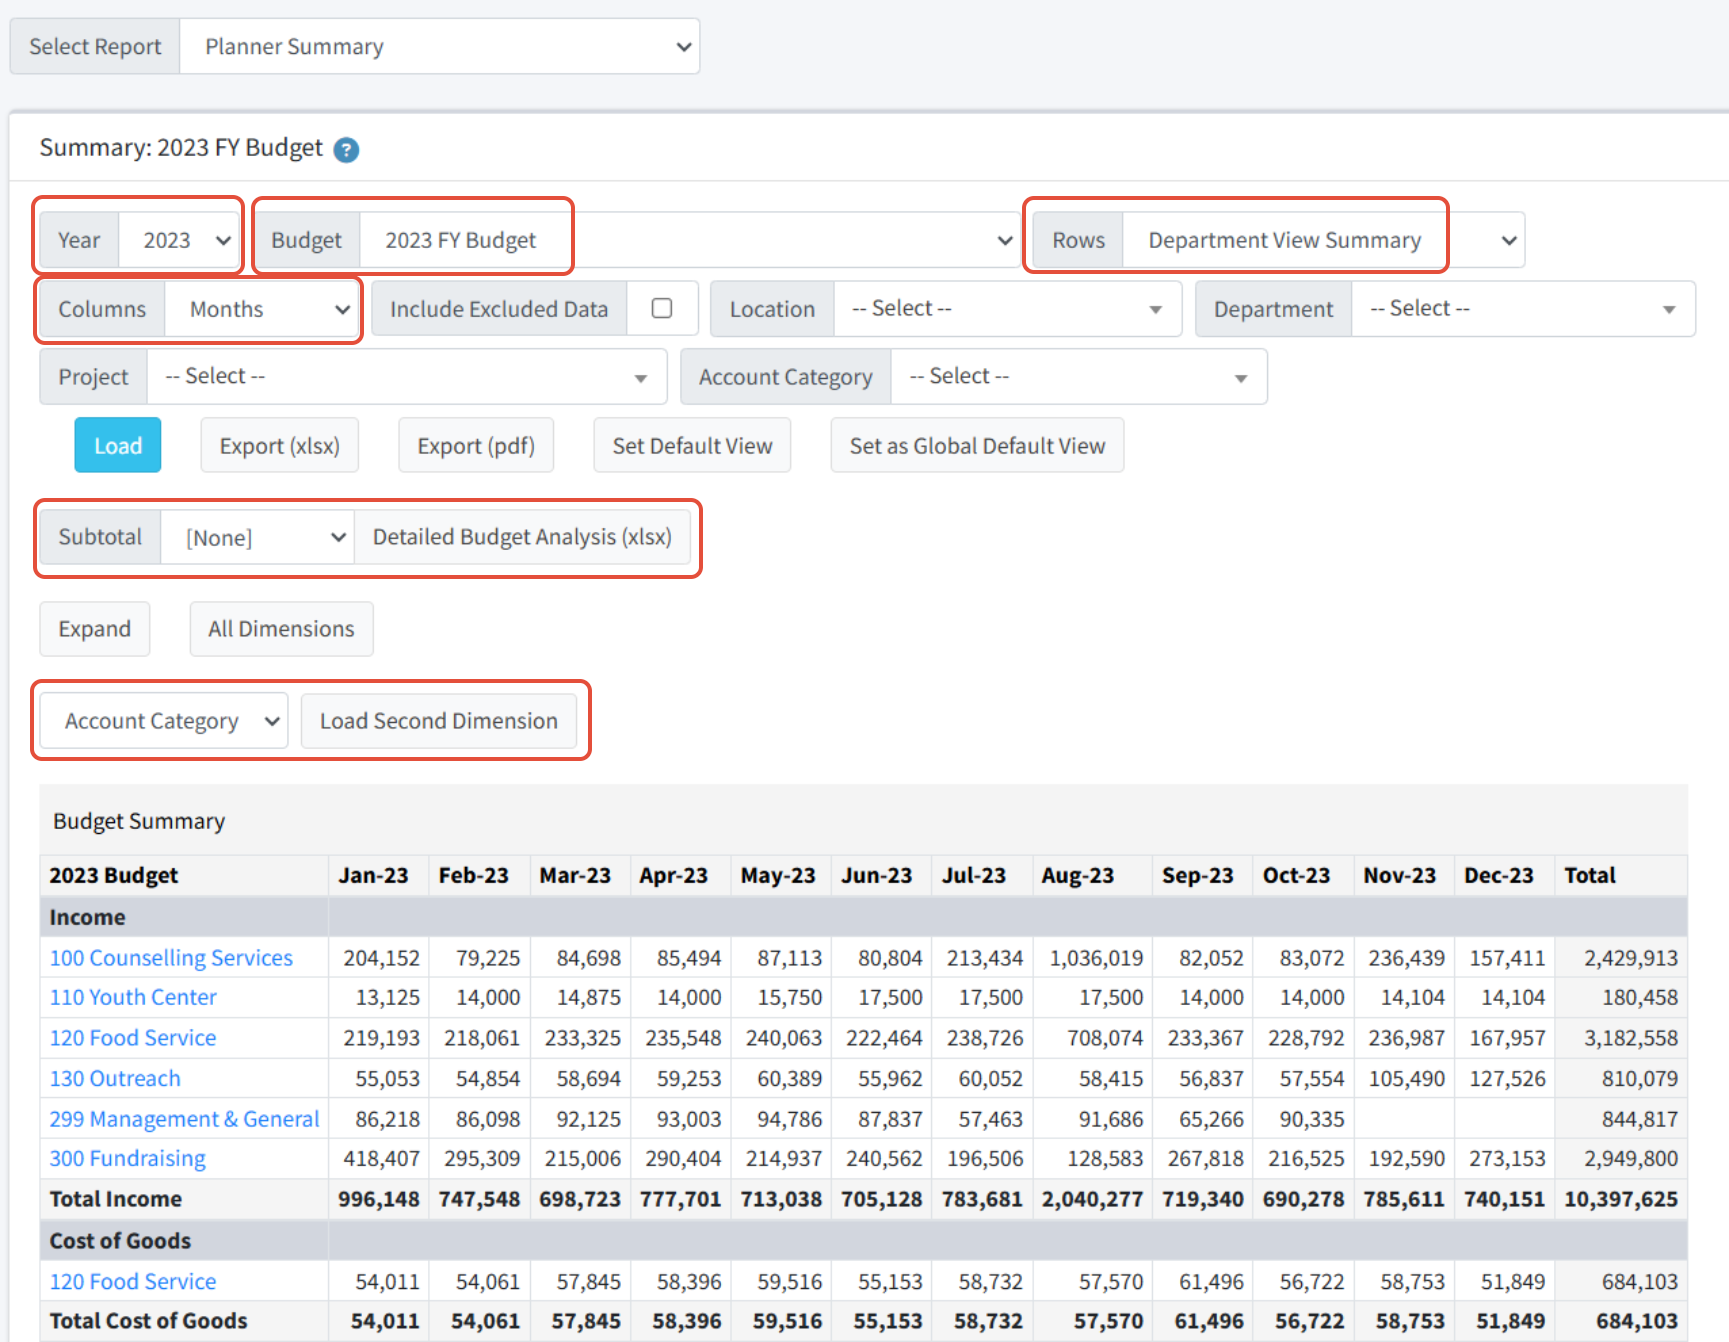
If you select a dimension filter, you can also choose a different dimension and click Load Second Dimension to summarize information by one dimension within another (for example departments within locations).
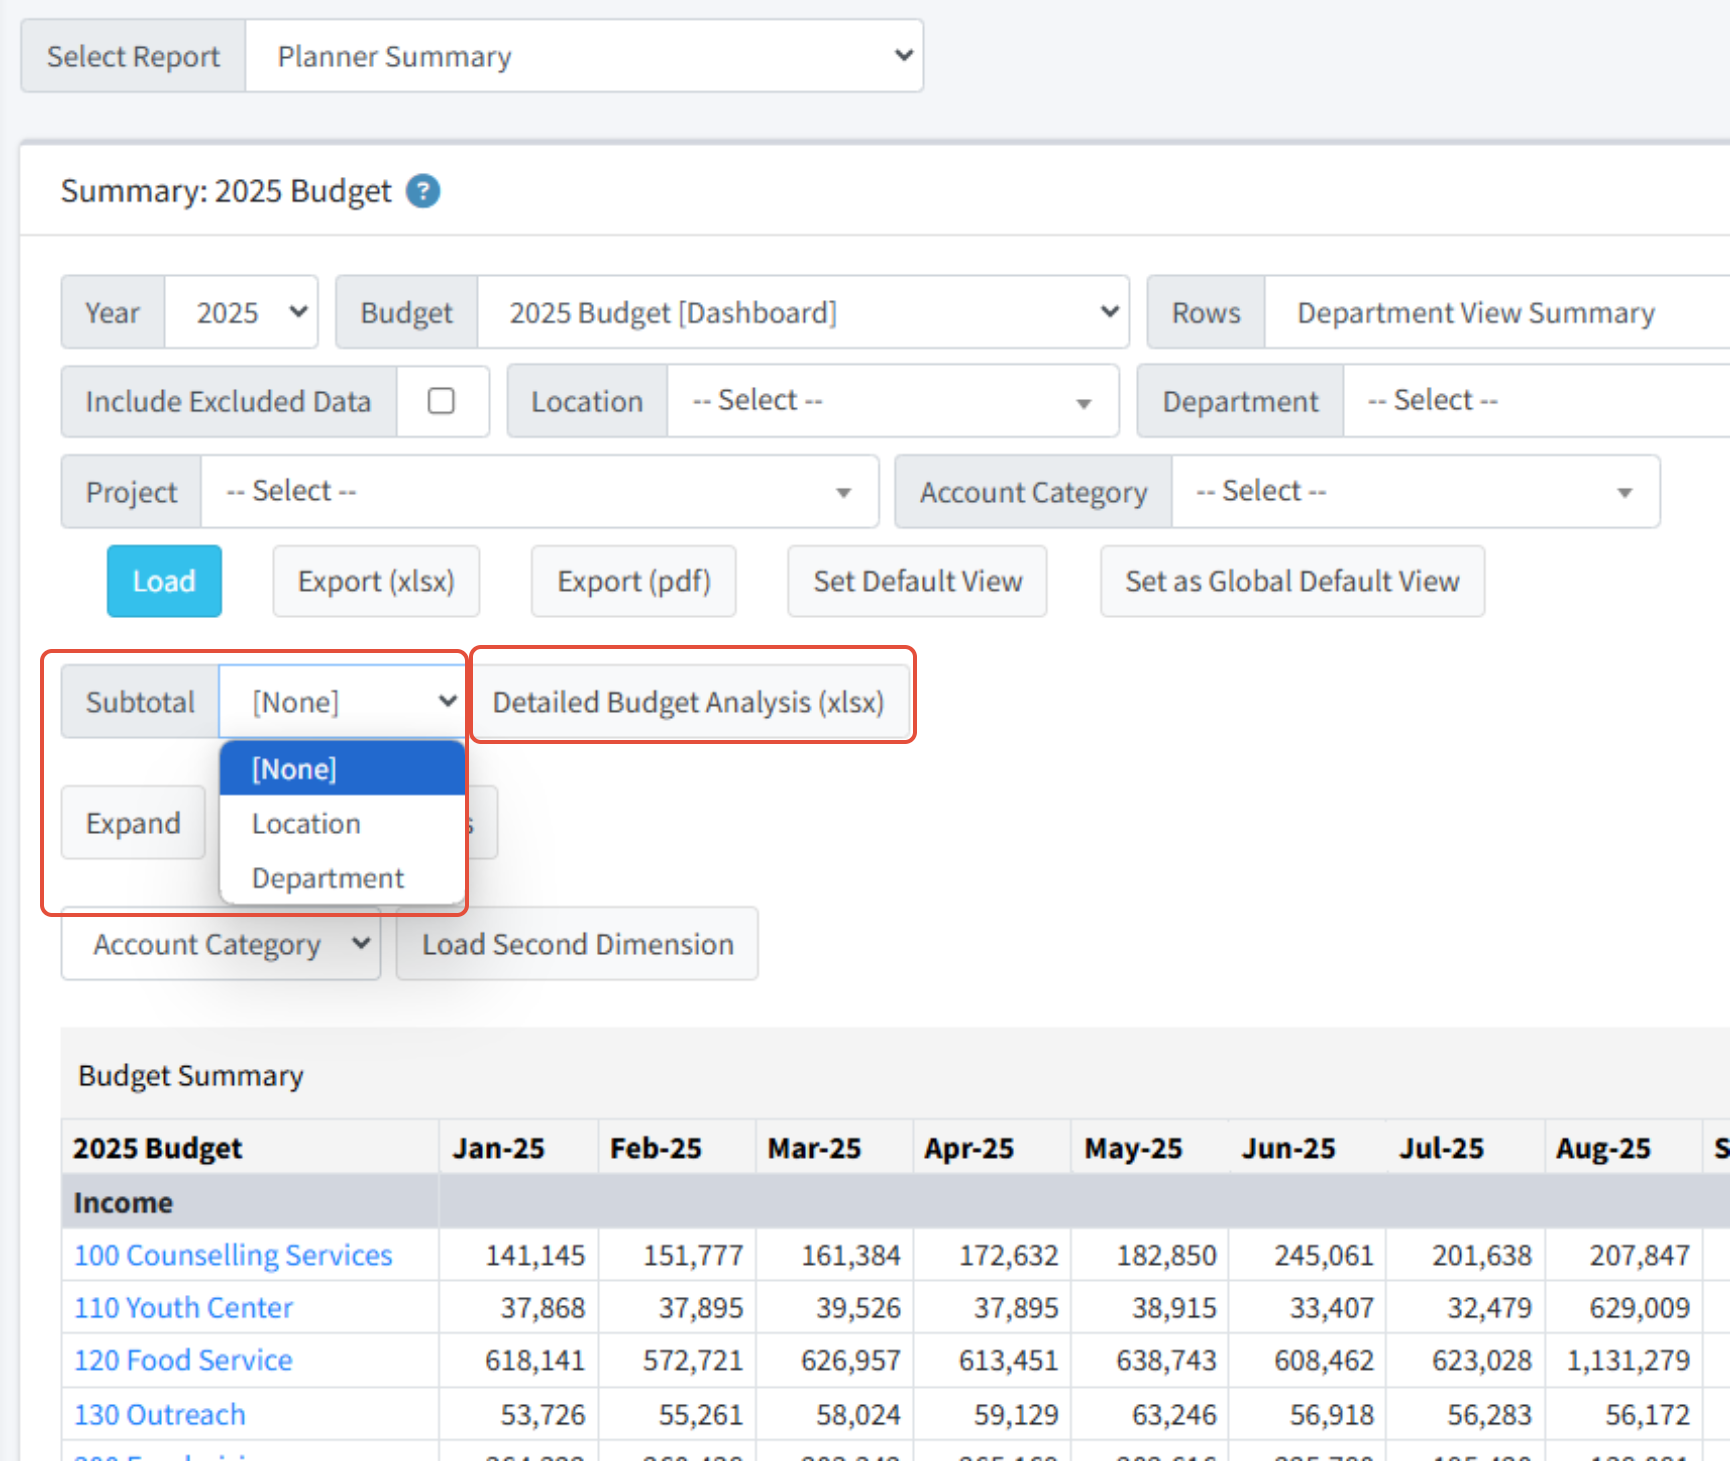
Detailed Budget Analysis (xlsx) Export
Export the Detailed Budget Analysis report to see a detailed report showing the entire budget, along with notes. Any note visible in a worksheet will be exported - including the notes from SPWs. Select a dimension to subtotal, if desired, and click Detailed Budget Analysis (xlsx). The Detailed Budget Analysis report shows all of the worksheet notes for a budget, including notes from SPW lines that post to that worksheet.
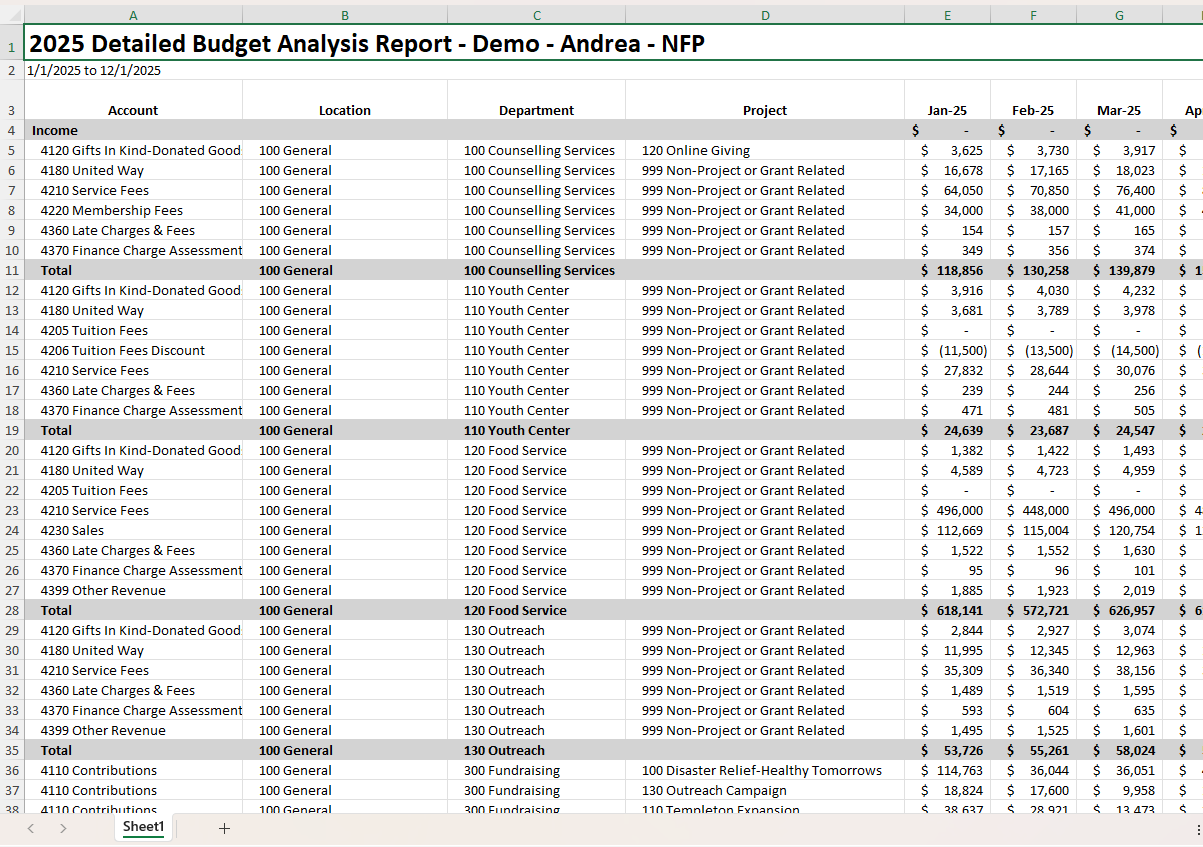
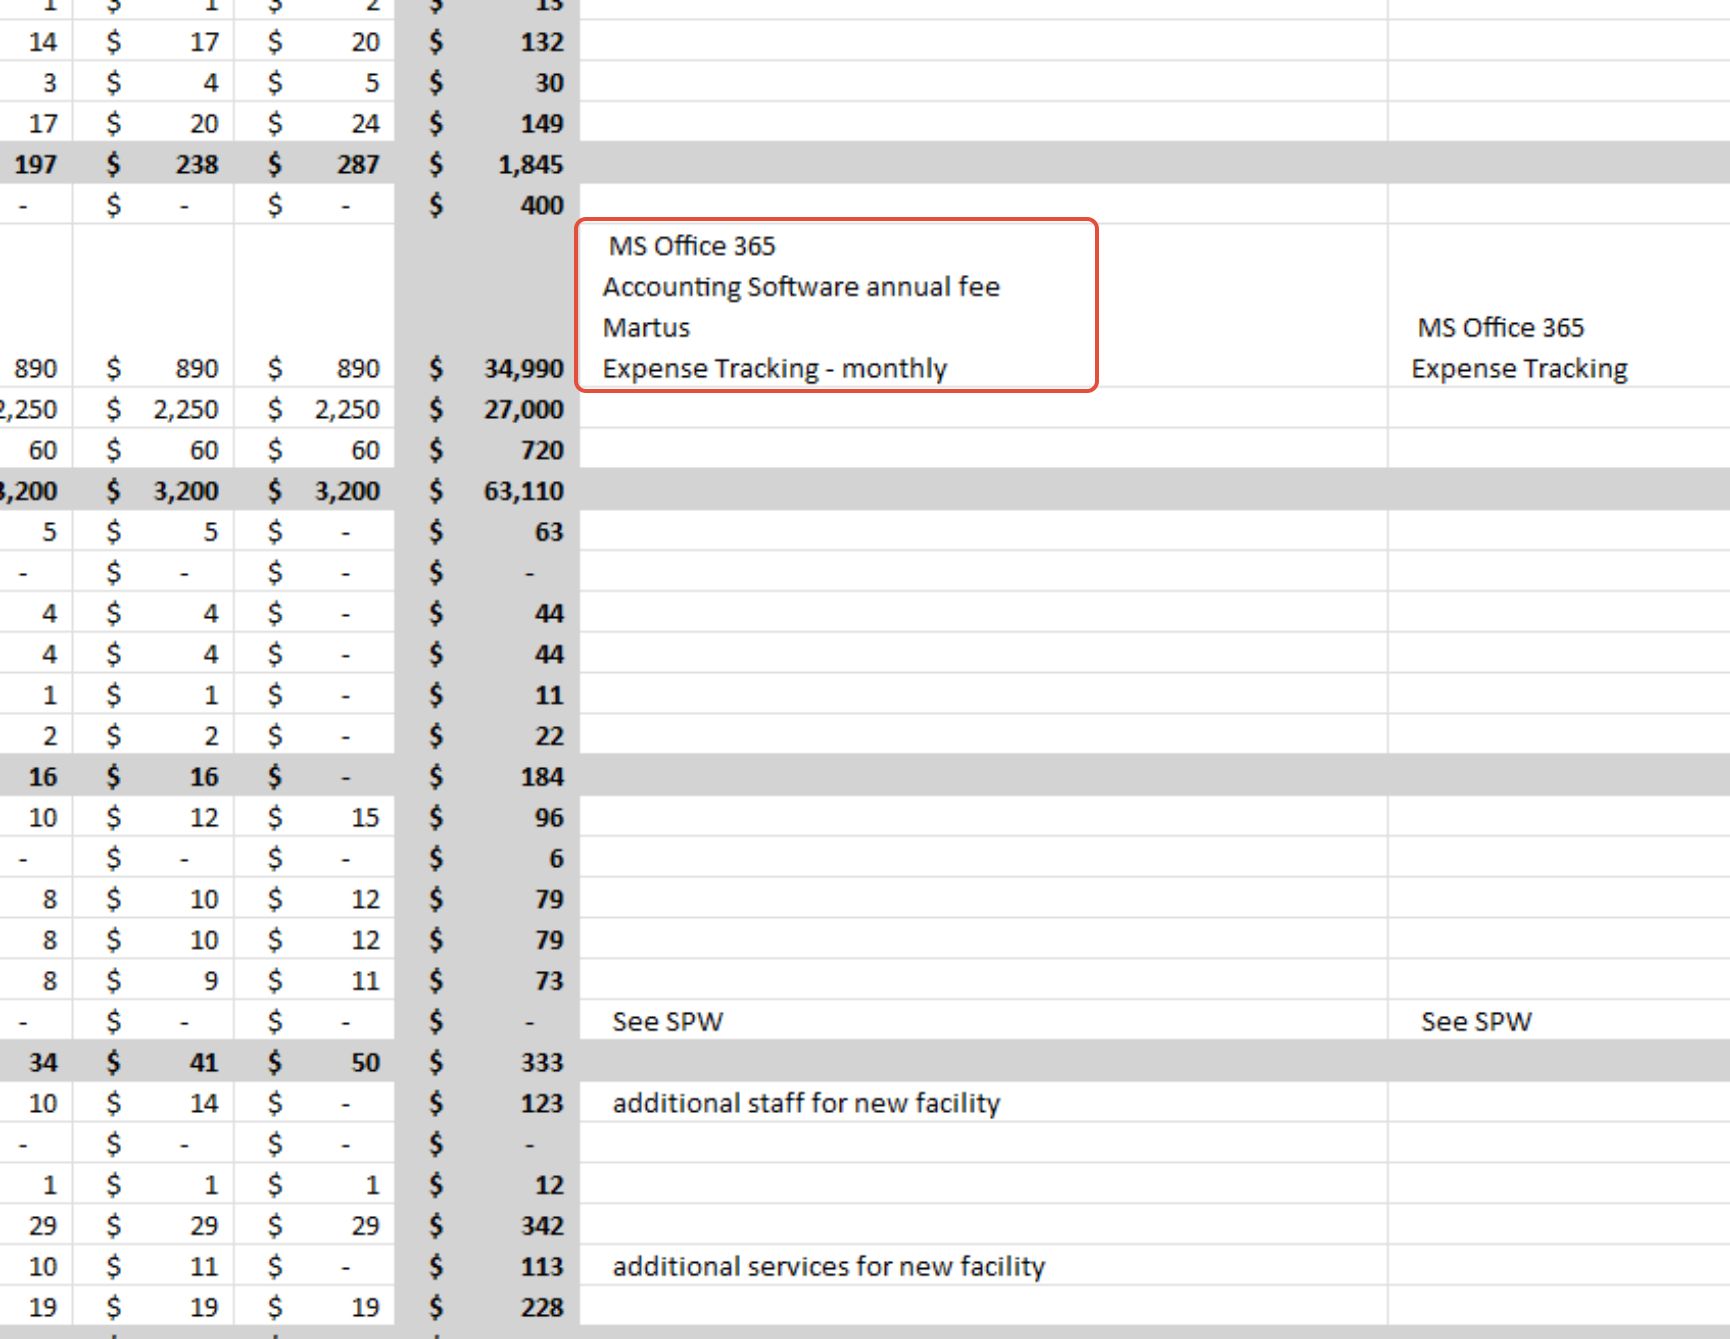
Planner > Summary > Budget Analysis Report
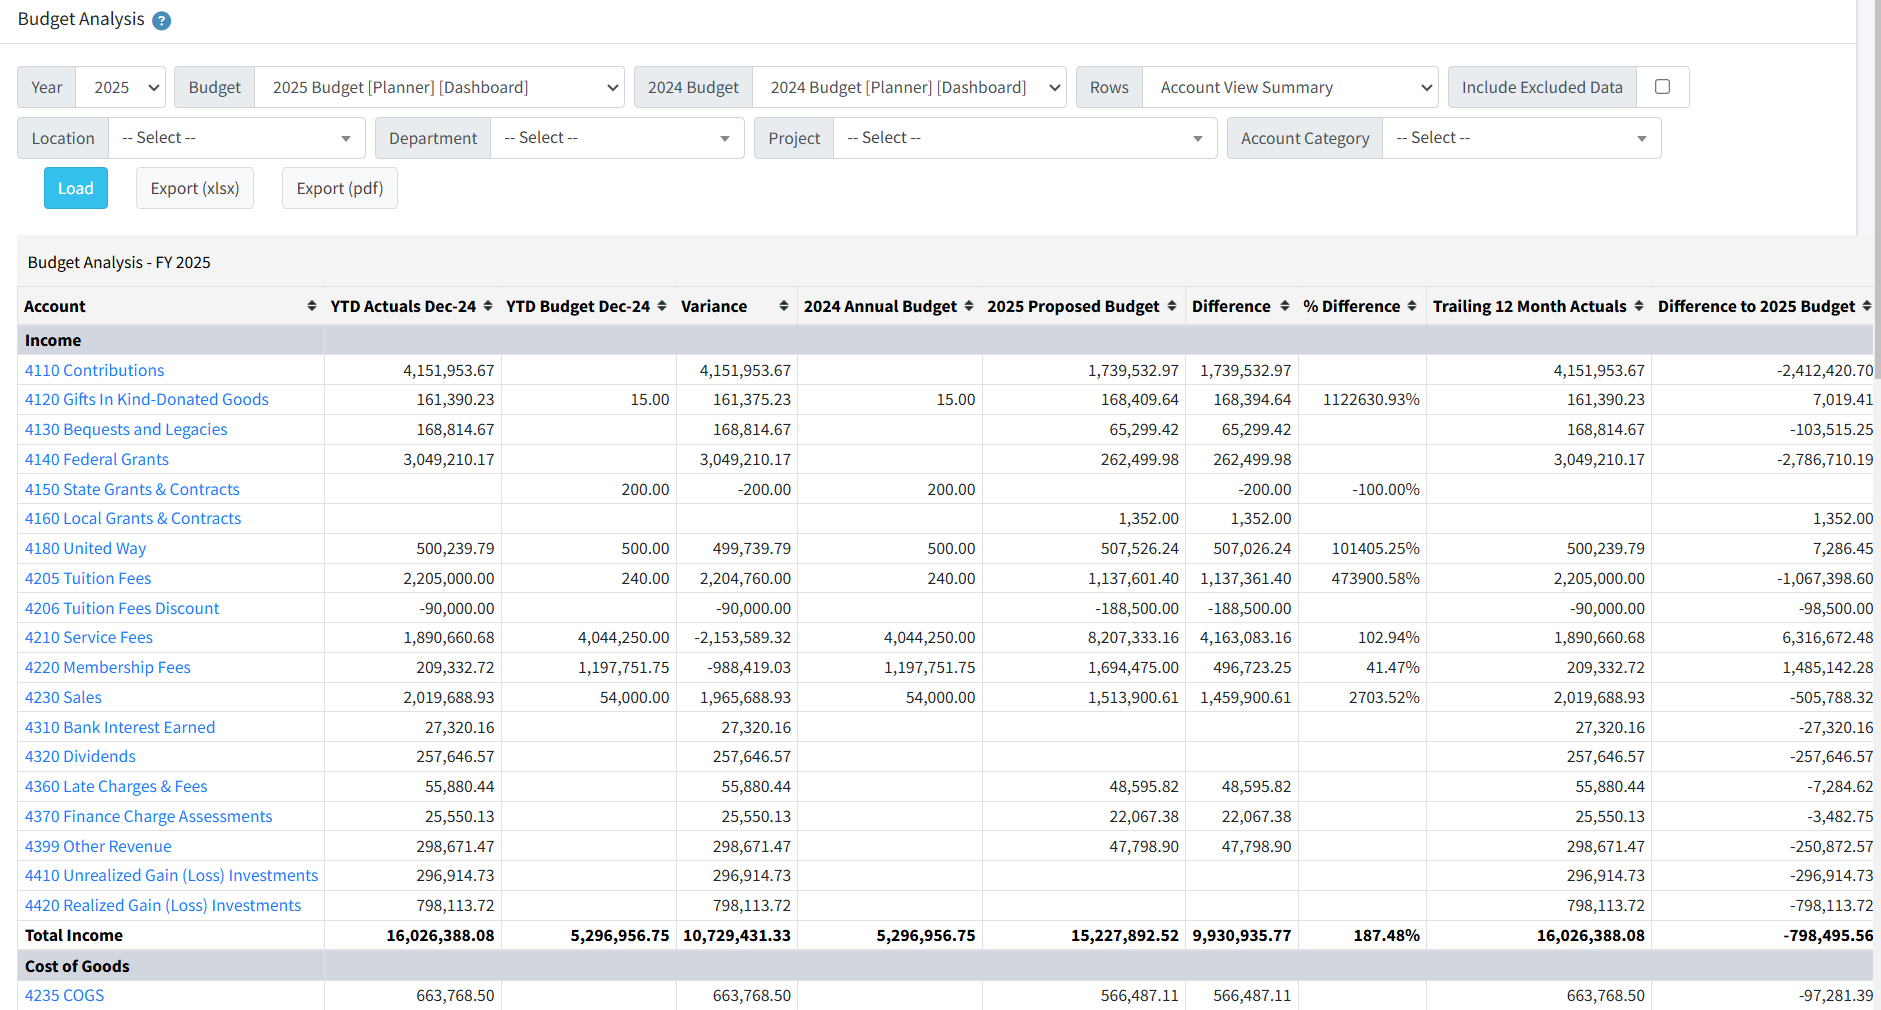
The Budget Analysis report compares two budgets from adjacent years.
Note: The use case for this report is to compare the current year's budget and actuals to the proposed budget for the following year. This report is not intended to be used to compare two budgets from within the same year. Additionally, if you select a year for which there are no budgets, the report will be blank.
The information shown includes:
- Actuals for the current year-to-date (through the current Default Month). When the current year's budget is for a completed year, these actuals are through the year end.
- Year-to-date budget for the current year.
- Variance between YTD actuals and YTD budget
- Total budget for the current year
- Total budget for the following year (identified in the heading as the Proposed budget)
- Difference in totals and percentage between those two budgets
- Trailing 12 month actuals (from the current Default Month). If the current year's budget is for a completed year, these actuals are for that year.
- Difference in totals and percentage between the trailing 12 months and the Proposed budget
- Current year actuals, annualized
- Difference in totals and percentage between the current year's annualized actuals and the Proposed budget
When selected, the report loads automatically with information from the default Planner budgets for the current budget year and the following year. If there is no Planner default for either or both of those years, you must select budget(s) and click Load in order to display the report. If you are an Admin user, you can also choose to use any other budgets from those years as the basis for this report.
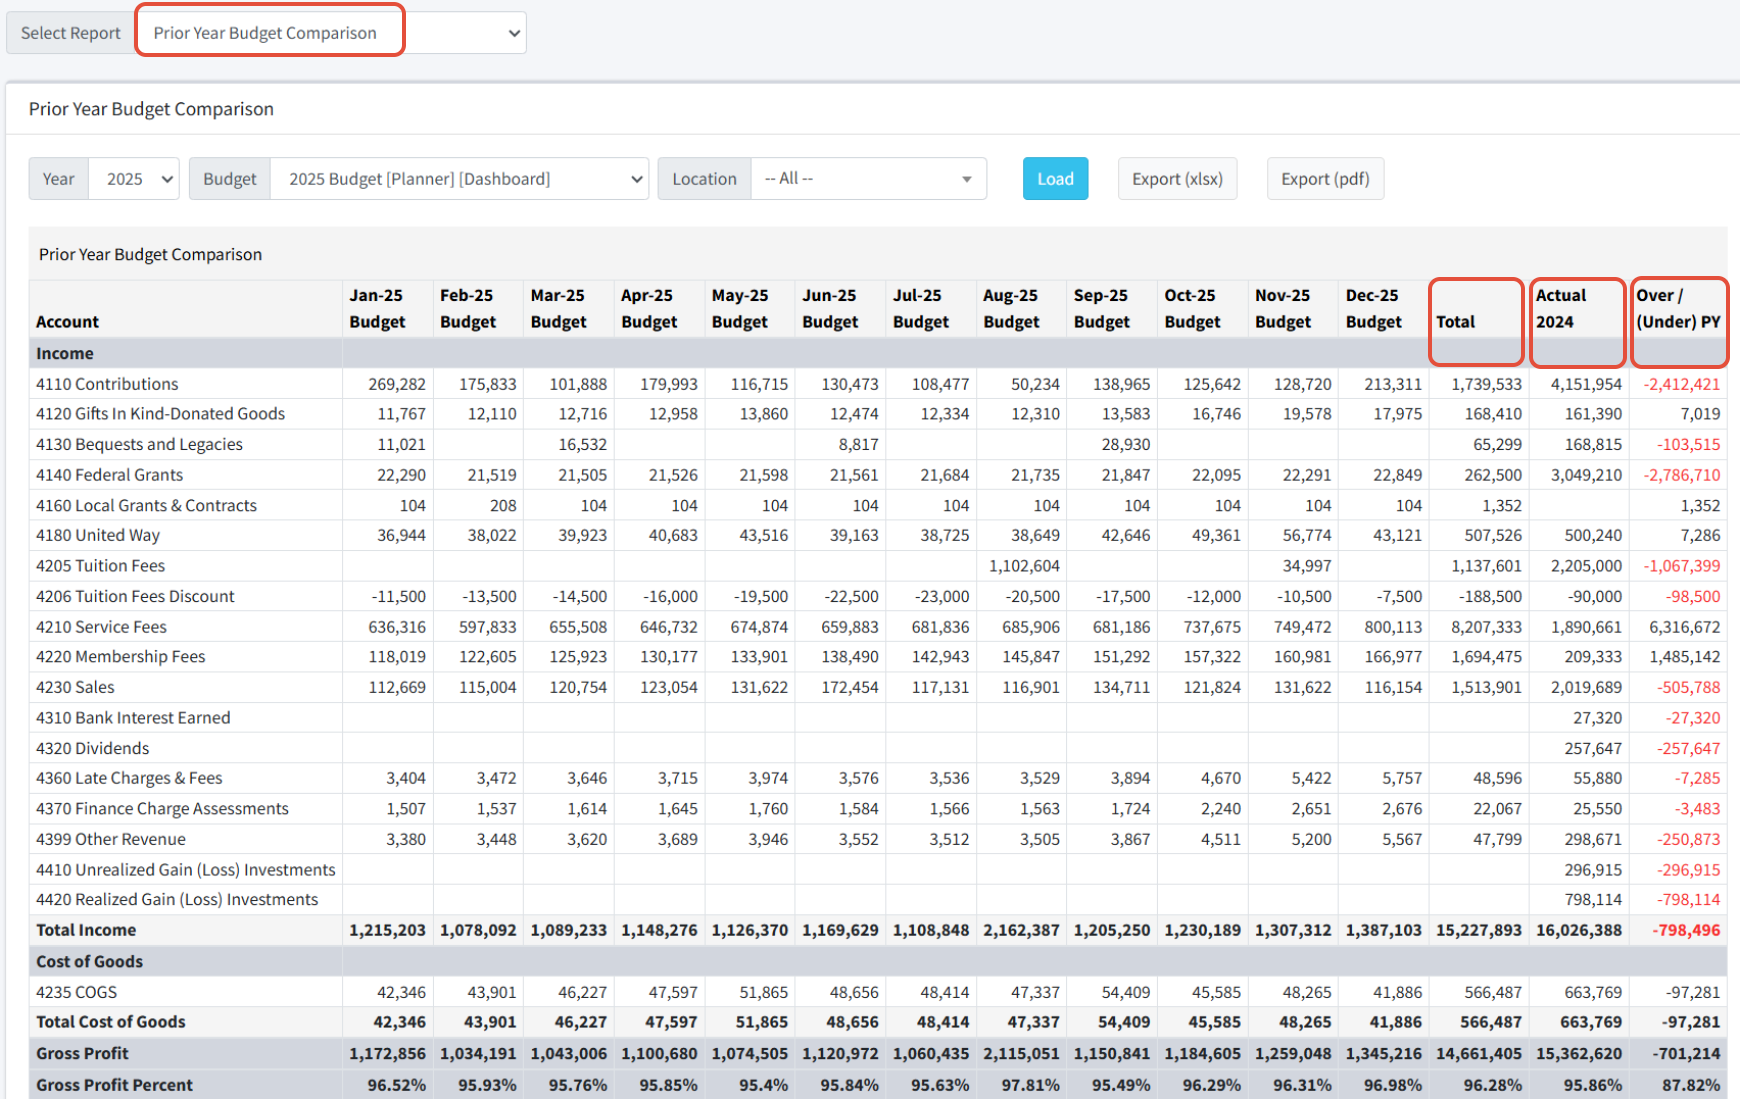
Planner > Summary > Prior Year Budget Comparison
The Prior Year Budget Comparison report compares the current year budget vs. the prior year actuals, and displays the Over/Under difference. You can change the year and budget to review a single prior year actuals vs budget.
You can change the year and budget, and filter on the top dimension.
Planner > Summary > Side-by-Side Budget and Actuals Comparison Report
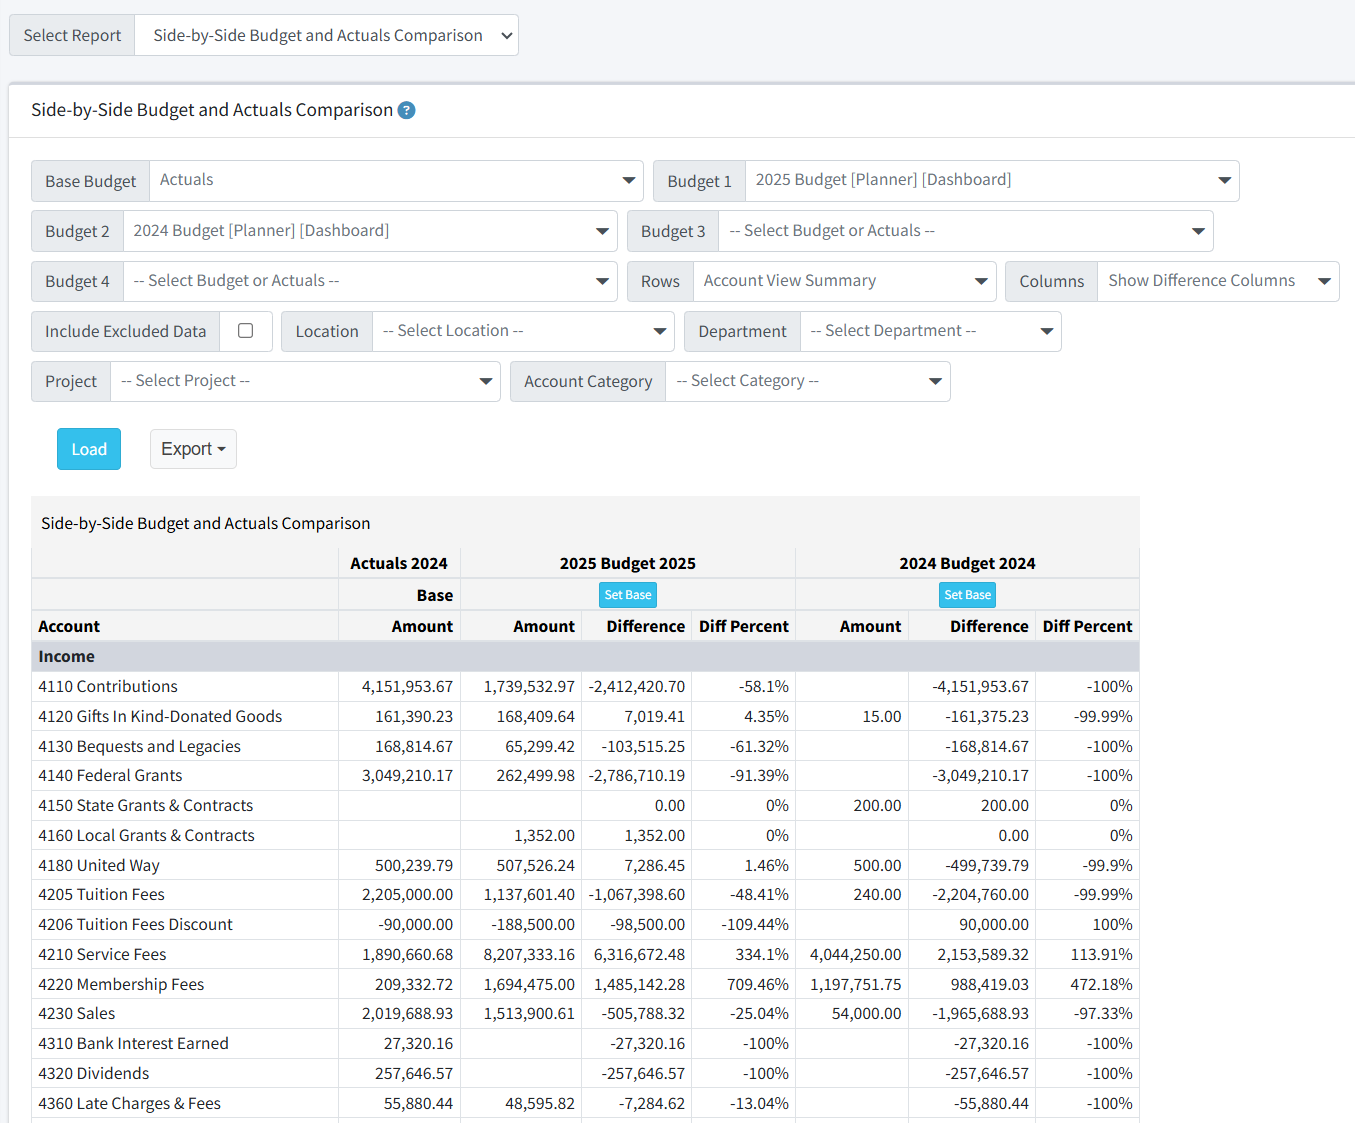
The Side-by-Side Budget and Actuals Comparison Report is accessed via Planner > Summary and allows a user to pick multiple budgets and/or actuals and compare them. Set the rows and dimensions, and hide or display the difference columns.
Non-admins can only see actuals, default budgets, and, if the user has the permission to View Non-Default Budgets, any other budgets that have been set as viewable for non-admins.
You can compare any five budgets or actuals from any year.
• The Base Budget (or actuals) is displayed in the left-hand column and is the basis to which the other selected data sources are compared.
• The difference columns (showing the absolute and percentage difference for each line) display automatically. This is controlled by the Columns dropdown. You can hide the difference columns if you wish.
• Hover over any amount to see the absolute and percentage difference between that amount and the base.
• Click Set Base to set the selected column as the source used as the basis of comparison.
• Use the Rows dropdown to display the report by GL account, account category, any dimension, or as a net gain/loss summary of both income and expense for any dimension.
• An Export always shows the difference columns, regardless of whether they are displayed on-screen.
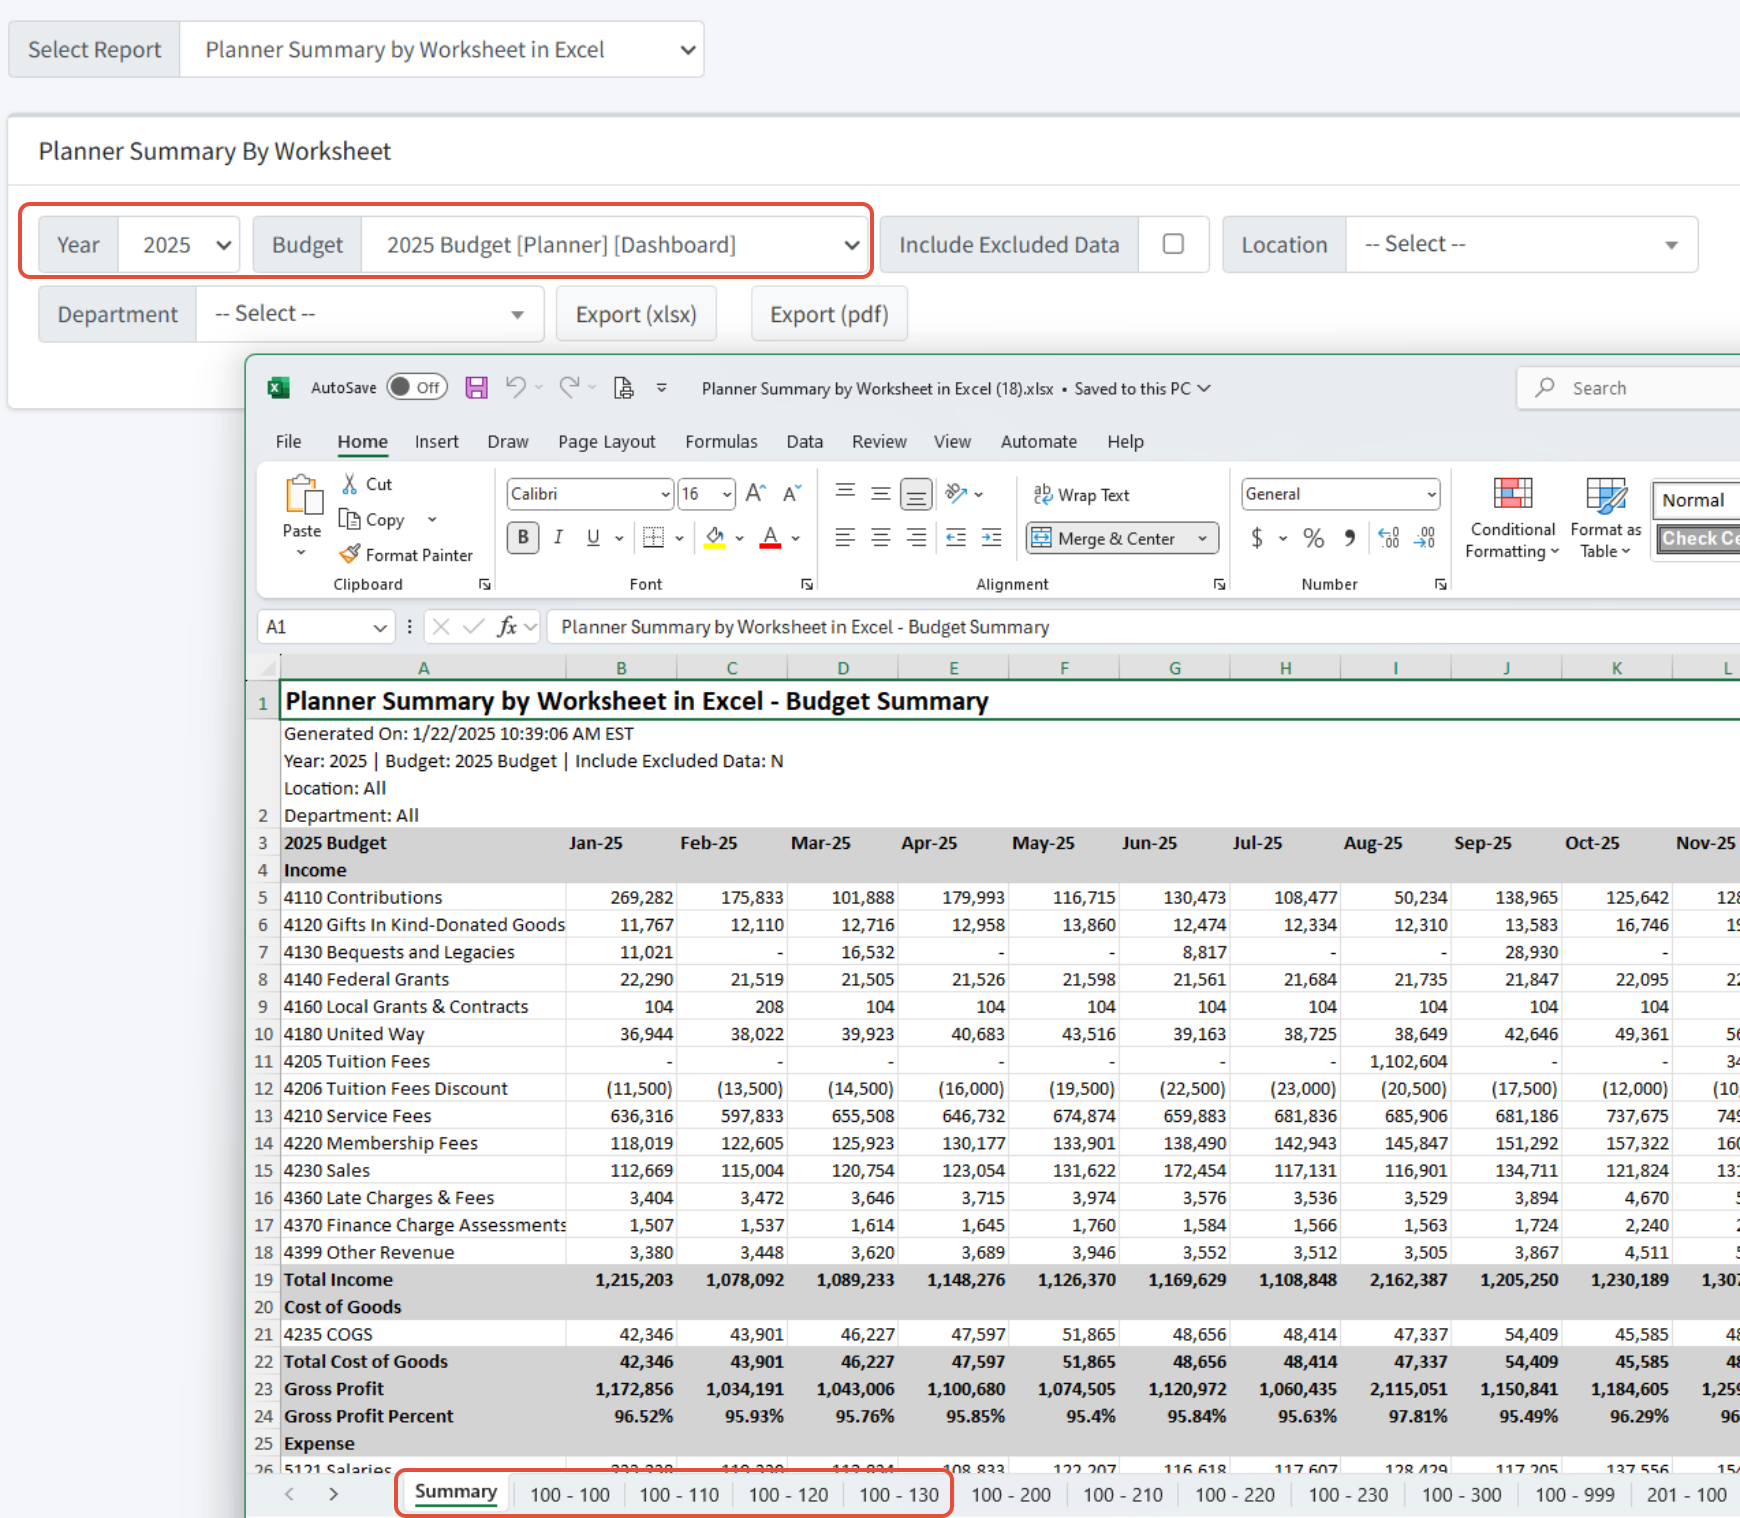
Planner > Summary > Budget Summary by Worksheet in Excel Report
You can Export a budget to Excel or PDF. Filter to specific dimensions if desired. The export will contain one Summary tab, and individual tabs for each budget worksheet.
Planner > Summary > Multi-Year Planner Summary Report
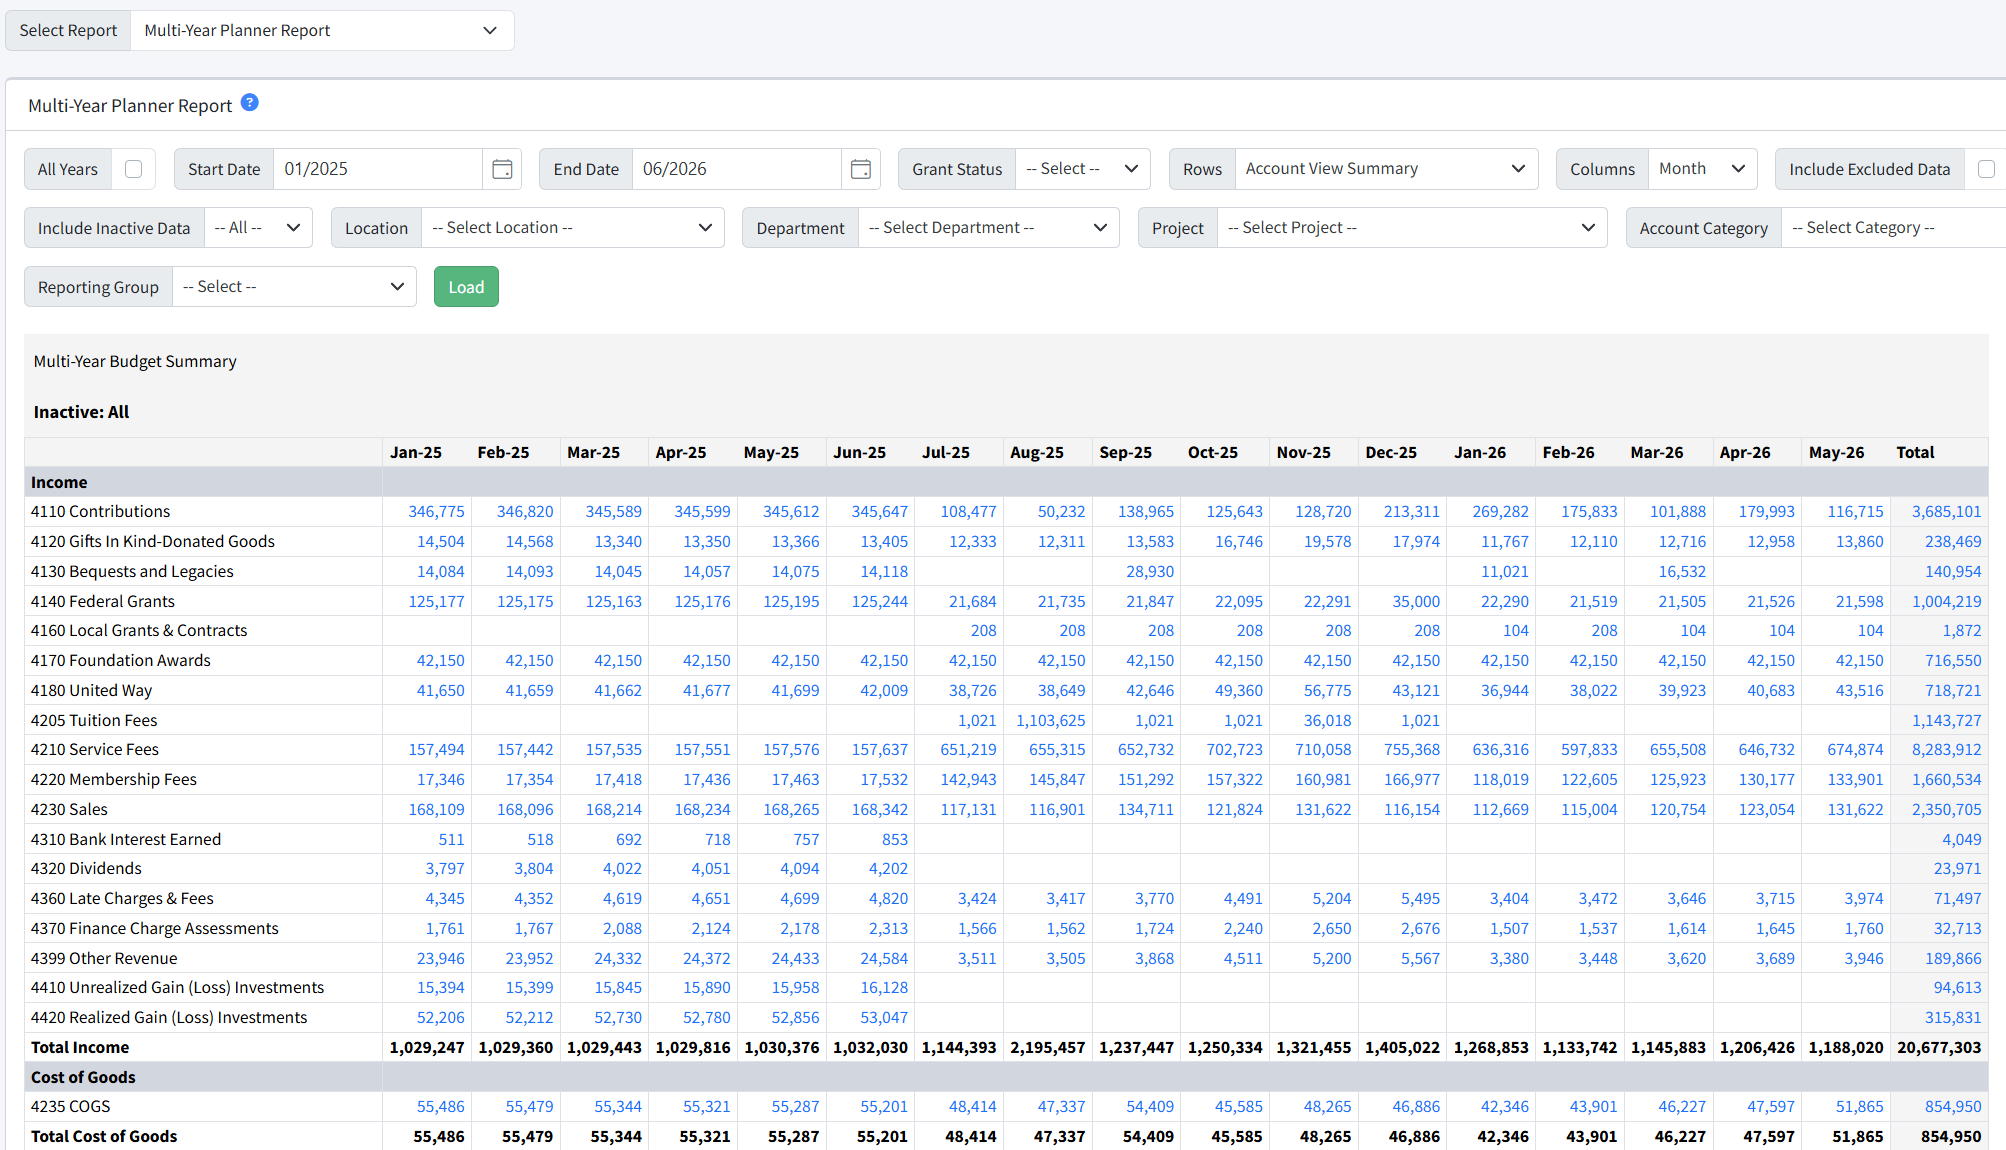
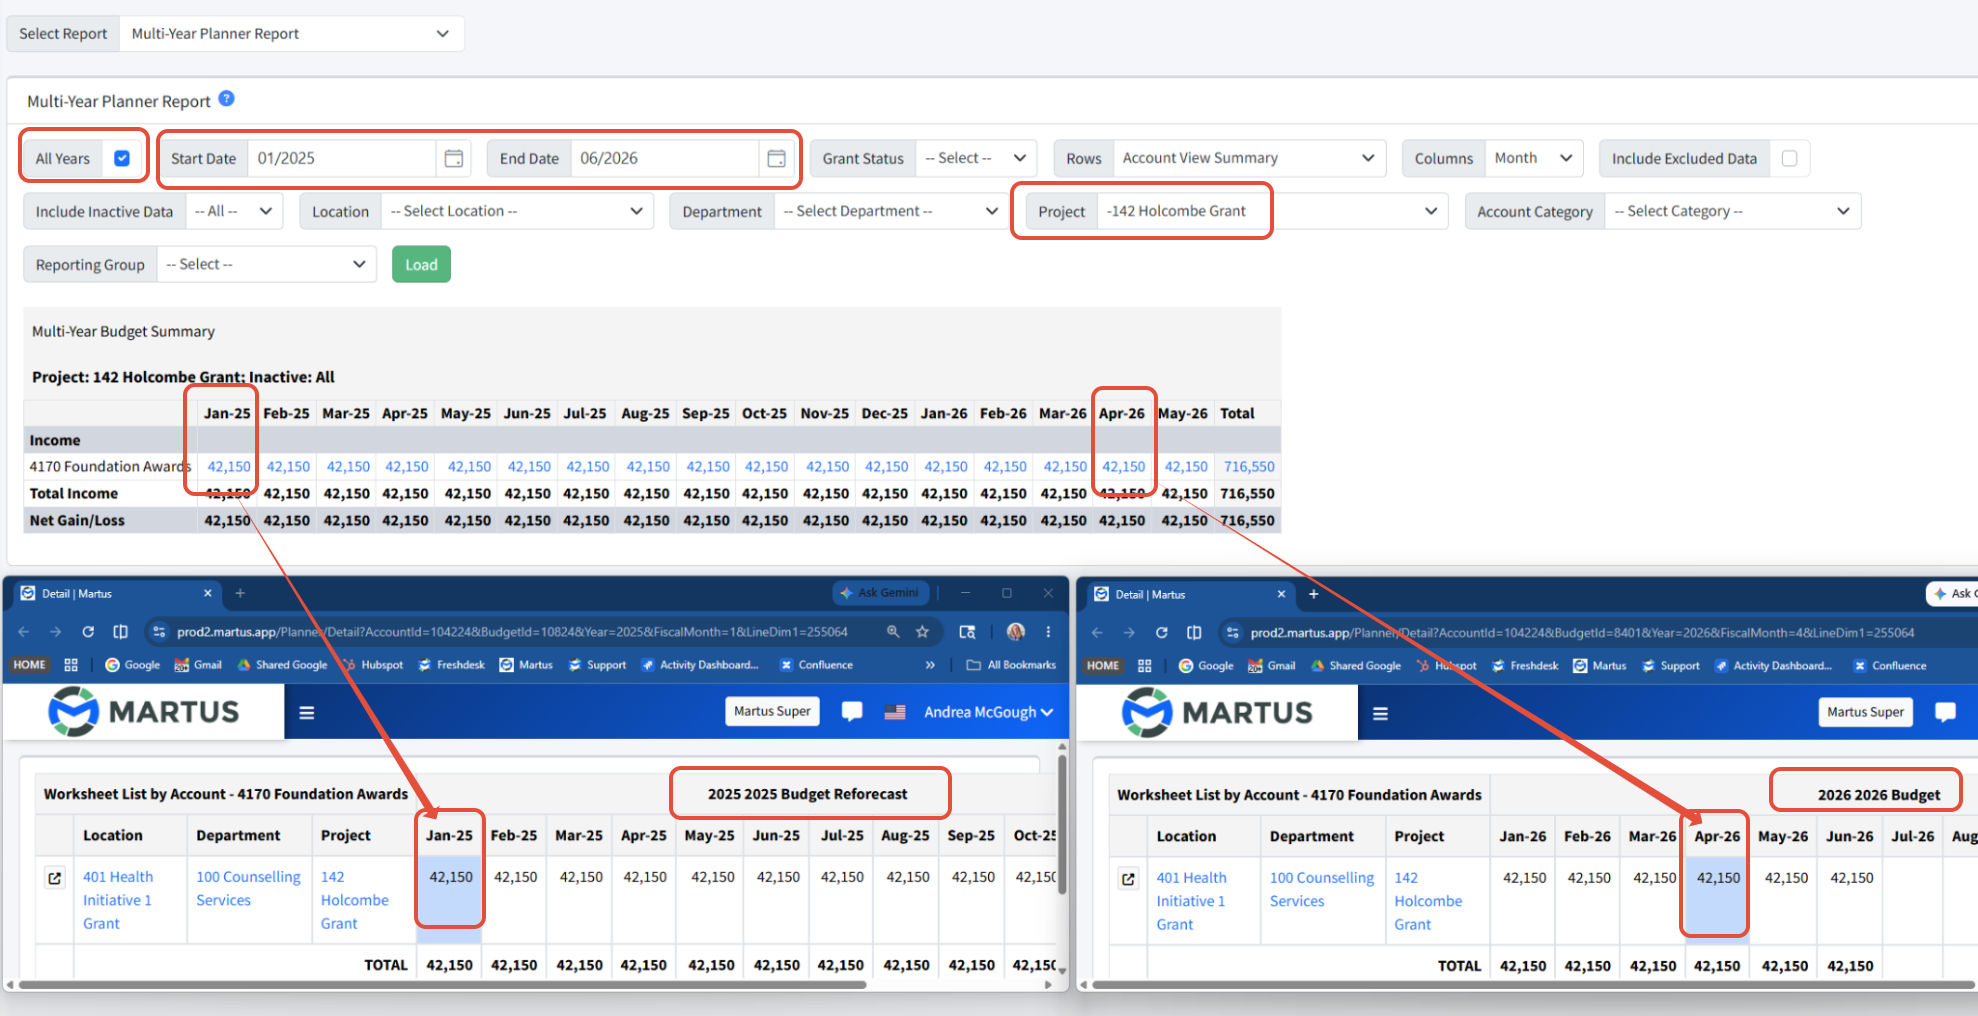
The Multi-Year Planner Report allows the user to report on an expanded range of months, over multiple years if desired.
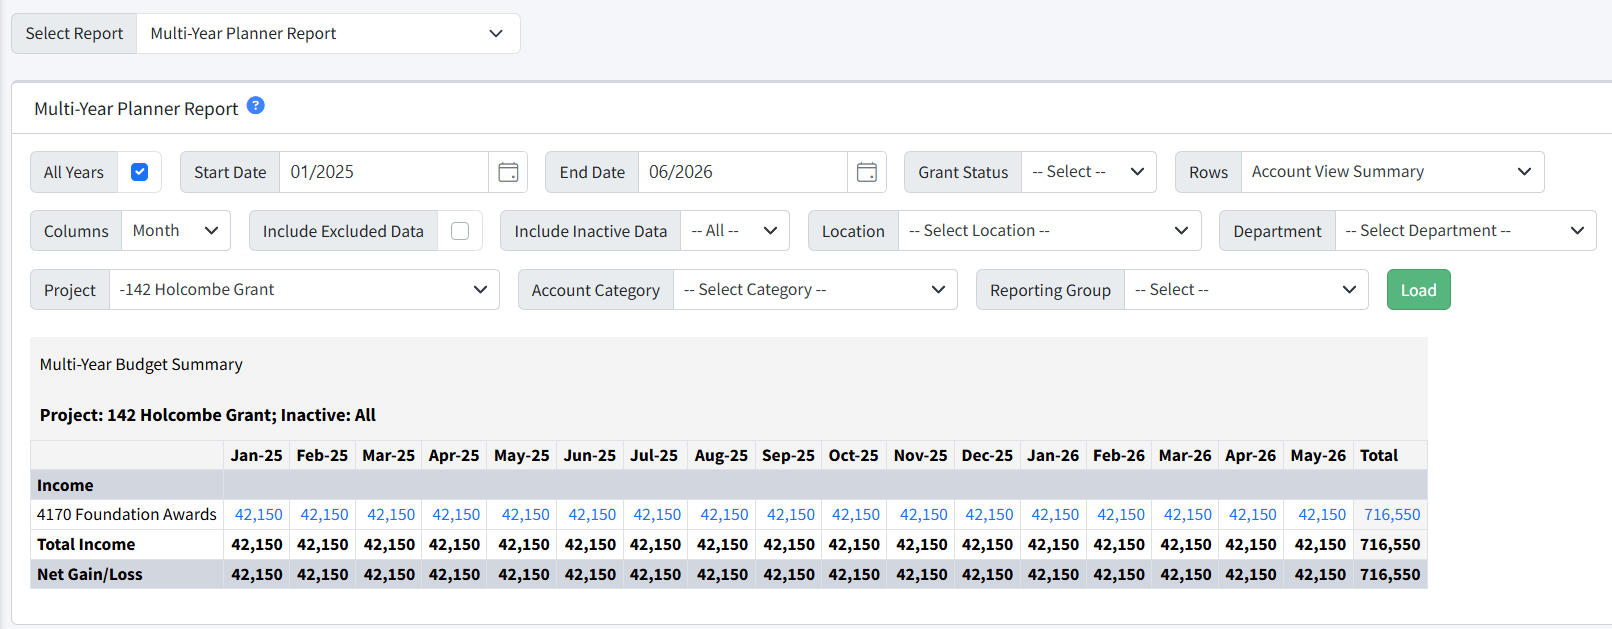
When used, the Multi-Year Special Purpose Worksheets (in BETA) allow for budging across multiple years in Martus. The Multi-Year Planner report shows details for the length of the grant if specified, or just for the span of the months set.
Report filters include the date range, the Grant Status, dimensions, etc.
Specify the Start Date and End Date to see the months desired in the report. Budgets in scope are the default planner budgets for each fiscal year.
Select a Grant dimension to view All Years.
Click a budget value hyperlink to view the worksheets for that planner budget for that month.
Planner Summary Reports - Overview
Martus offers a suite of budget reports. Each report is unique in the data that is shown and how it is displayed. Every report is similar in that it can be adjusted via the report criteria section.
Every user who accesses Planner > Summary reports will only see data for which they have been granted permission via their dimension restrictions and account settings. For more information on setting up users and managing permissions, click here.
Report Naming & Terminology
- For non-profit clients, reports will generally use "income" in section headings and summaries.
- For for-profit clients, reports will generally use "revenue" in section headings and summaries.
- Any client can change the default names of specific reports using the override in Setup > Branding > Report Names. Screen headers, menu options, and report outputs will align with the override(s).
Anatomy of Planner Summary Reports
Report Controls
All report controls will prompt Martus to auto-update to the action taken. The Load button in the report criteria section should only be utilized when the report criteria is changed.

- Select Report - The dropdown is used to navigate to the various Planner Summary reports. The control displays the name of the current report.
- Set Default View - Each user can set their own default report. This will be the report that is displayed when the user navigates to Planner > Summary.
- Set as Global Default View - Only available to Admin Users. This allows the Admin to set the default view for all Martus users. This can be overridden by the individual user after it has been set.
Report Criteria
Most reports can be customized using common filters and selectors. (Specific report articles can be found using the links at the bottom of this article.) Report criteria is "sticky", meaning it will stay selected when navigating to other reports. This allows the appropriate information to be seen on the new report without having to reset the criteria.
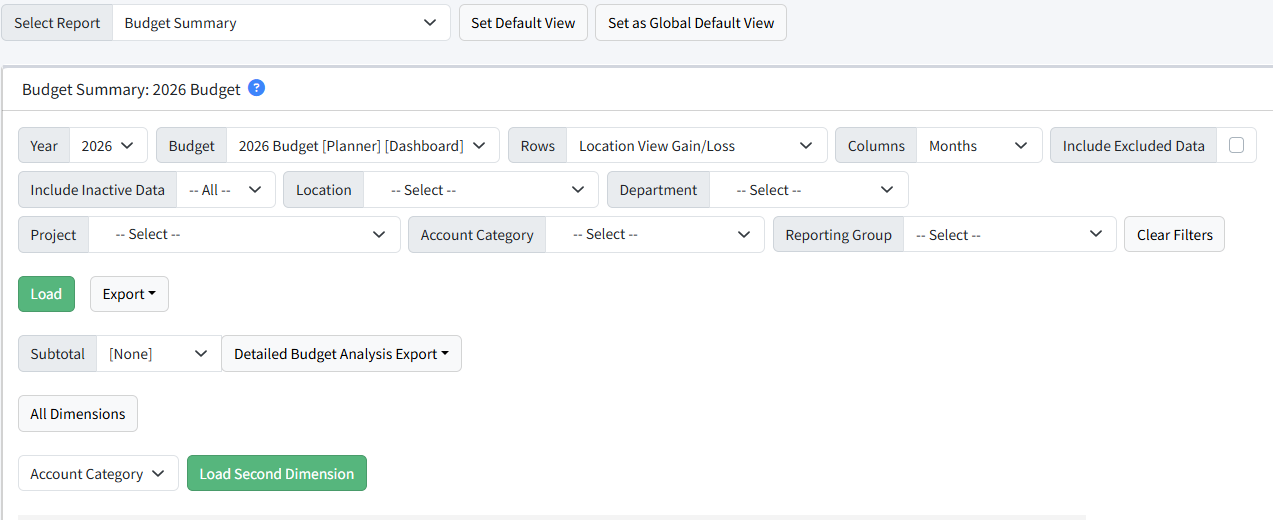
The most common report criteria are explained below.
- Year - Select the budget year.
- Budget - Allows the user to choose which budget or budgets to view. By default non-admin-users will only see the default budgets.
- Rows - Controls the grouping of data on the rows. The rows can be set to accounts, account categories, or any of the dimensions within the system. On most reports, there is an option to load a second dimension or view all dimensions (parents & children) in a new report.
- Columns - Can be set to months or dimensions.
- Include Excluded Data - Show accounts and/or dimensions that are set to Excluded via the Setup section.
- Include Inactive Data - This defaults to All, which includes active and inactive data. Inactive dimensions are appended with [I]. Parent/child relationships with inactive parent dimensions are rolled up.
- Dimension Filters - When applied, these will filter the report to the selected dimension. When a top-level dimension is selected, the report will show all sub-dimensions.
- Account Category - When applied, these will filter the report to the selected account category.
- Load - refreshes the report with whatever criteria have been applied
- Export - Most reports can be exported to either Excel or PDF. Reports can be emailed in either format as well, and users can set schedules for the reports. Additional information is below.
- Reporting Group - Allows a report to be filtered on any combination of dimensions or accounts. Admins can create and manage Reporting Groups for all users to use within reports.
- Clear Filters - Resets all filters to --Select--.
- Expand - Loads the report in a new tab, expanded to the account level.
Report Display
Information displayed will vary based on the report chosen and the criteria set.
- Dimensions on Rows - Navigates to that dimension, expanded.
- Accounts on Rows - Navigates to a list of worksheets for which that account is budgeted.
Emailing & Scheduling Reports
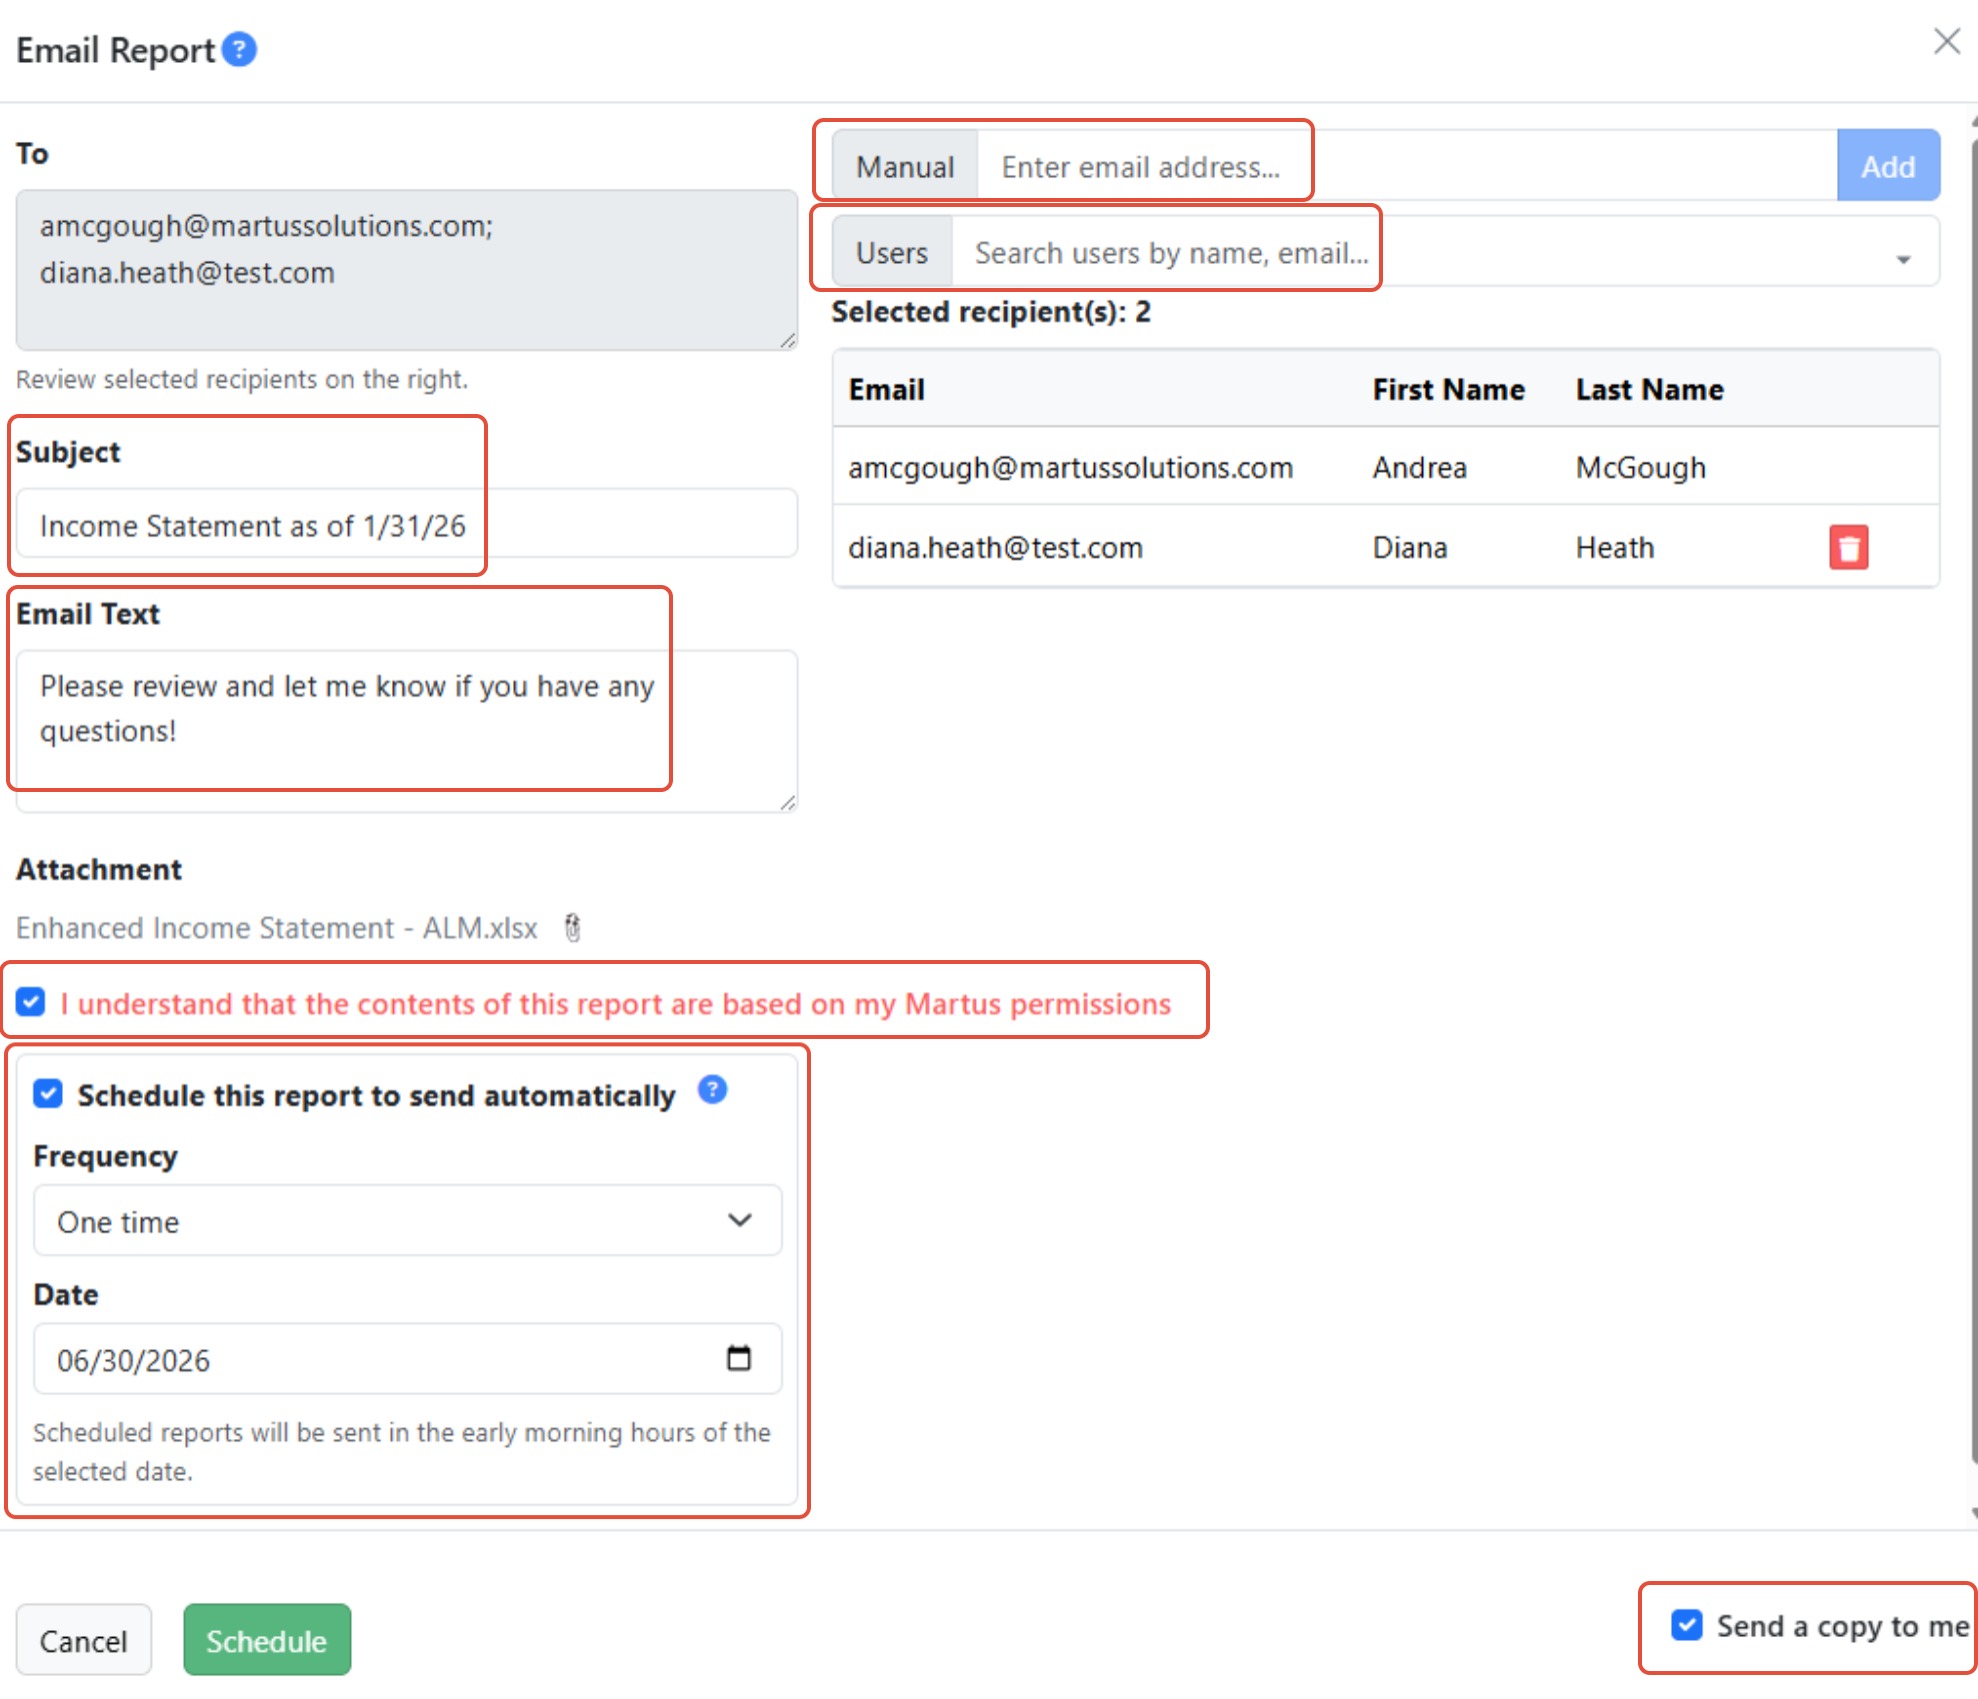
You can email reports to Martus users and outside addresses, and also set schedules if desired.
- Click Export, and then either Email (xlsx) or Email (PDF).
- Manually enter email addresses one at a time and click Add, or select from the available Martus users using the fields to the right.
- Add the Subject and Email Text.
- Verify the correct Attachment is show below the Email Text.
- Choose to send a copy to yourself by checking the box in the lower right.
- Check the box 'I understand that the contents of this report are based on my Martus permissions' to verify that the contents of the report may contain sensitive information not appropriate for specific recipients. You must click this box to activate the Send button.
- If desired, schedule the report to send automatically. Choose the Frequency (One time, Daily, Weekly or Monthly) and additional parameters.
- Click Send to send the attachment and email to the recipients.
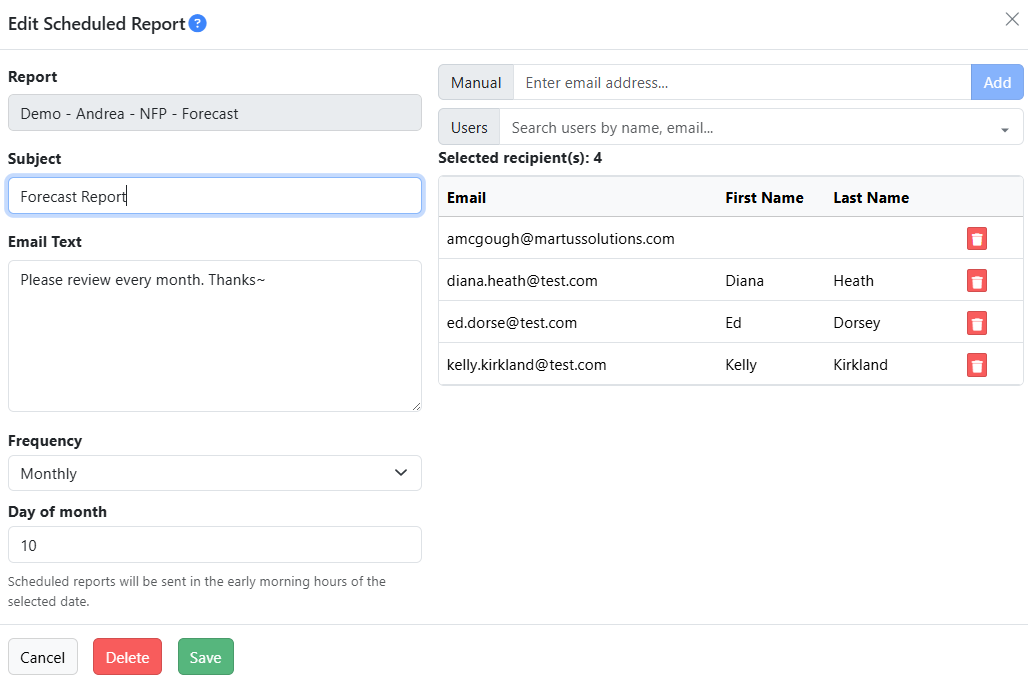
A Martus Admin can manage email schedules in Admin Reports > Scheduled Email Reports. View the schedules by sender and report name, the number of recipients, the set schedule, next send date and last send date.
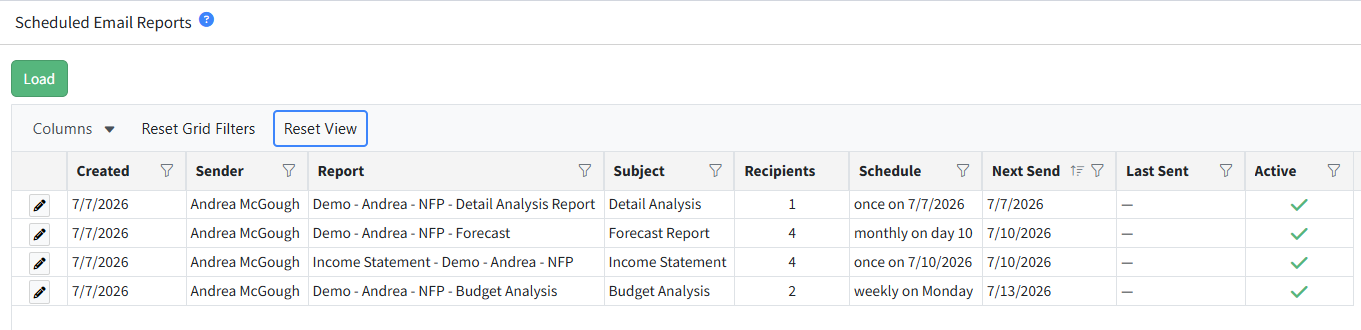
Click the Edit pencil to update or delete the schedule. Manage the recipients, subject and email text, and the frequency and associated values for that sc